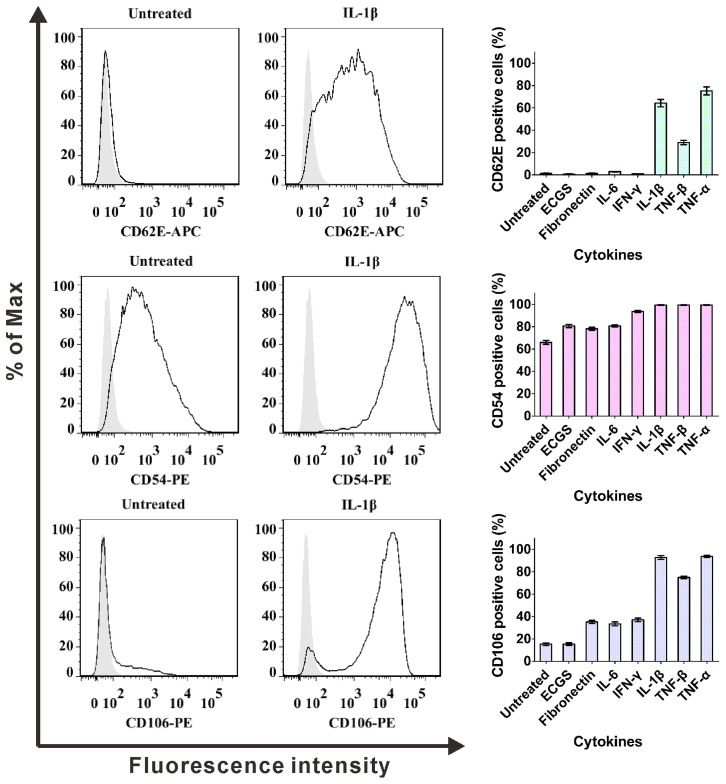
Figure 3. Flow cytometric analysis of cytokine-stimulated CD62E (E-selectin), CD54 (ICAM-1) and CD106 (VCAM-1) expression by HUVECs.
HUVECs was cultivated with IL-1β (1 ng/mL), TNF-β (10 ng/mL), TNF-α (10 ng/mL), IL-6 (10 ng/mL), IFN-γ (10 ng/mL), ECGS (100 μg/mL) and fibronectin (100 ng/mL), respectively, for 4 h. Expression of CD62E, CD54 and CD106 were detected by flow cytometry using silver area as isotype controls. Bar graph shows the percentage of positive cells (right panels), contour polt analysis (left panels) shows CD62E+, CD54+ and CD106+ cells, in comparison with isotype controls. Bars represent the mean ± SEM (n = 3).

