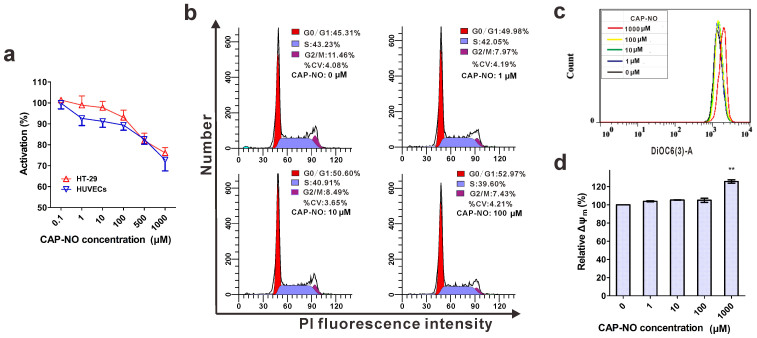
Figure 5. Inhibitory effects of CAP-NO.
(a) The HT-29 cells and HUVECs were separately exposed to different concentrations of CAP-NO for 24 h. The cytotoxicity was determined by MTT assay and expressed as the percentage of the controls. (b) Effect of CAP-NO on cell cycle. HT-29 cells were incubated with CAP-NO (0, 1, 10 and 100 μM) for 24 h. The cell cycle was assessed by flow cytometry. Cell cycle distribution was analyzed using the Modfit software, CVs <8% are recommended for useful S-Phase determination. (c and d) Effect of CAP-NO on Δψm. HT-29 cells were exposed to CAP-NO (1, 10, 100 and 1000 μM) for 12 h, respectively. The Δψm was determined by flow cytometry. Δψm levels of HT-29 cells were expressed as the mean fluorescence intensities and calculated as percentage of controls. Bars represent the mean ± SEM (n = 3); ** indicates P < 0.01.

