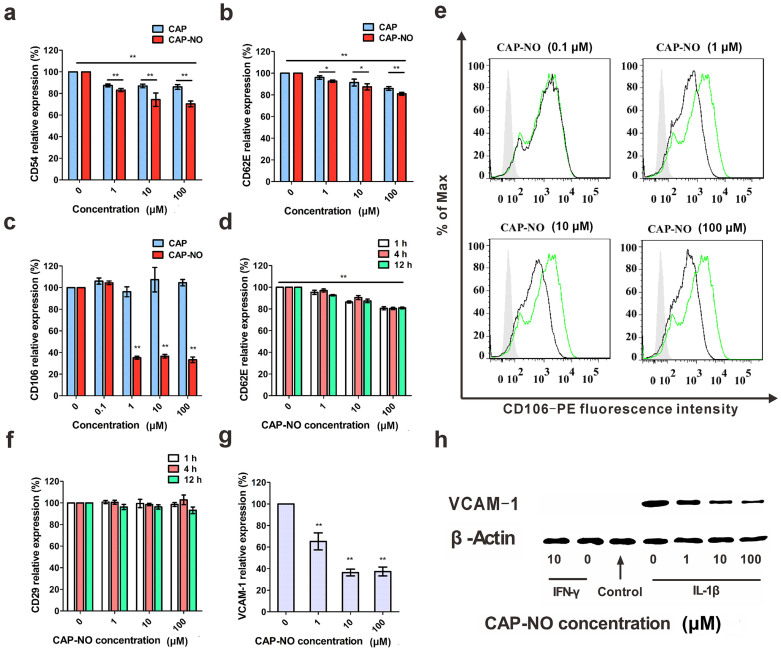
Figure 6. Flow cytometric and western blot analyses of effects of CAP-NO and CAP on CAMs.
HUVECs were pretreated with 1 ng/mL IL-1β for 4 h followed by incubation with CAP-NO or CAP for another 12 h (unless otherwise stated). Flow cytometric analysis showed significant inhibition by CAP-NO on expression induced by IL-1β (1 ng/mL) of ICAM-1 (a), E-selectin (b), and VCAM-1 (c). Results are expressed as the mean fluorescence intensities and calculated as percentage of controls. (d) Effects of CAP-NO on E-selectin expression at indicated time points. (e) Expression of VCAM-1 determined by flow cytometry using green curve as a control (IL-1β only), and silver area is an isotype control. (f) Effects of CAP-NO on CD29 expression at indicated time points. (g and h) Western blot analysis of VCAM-1 expression by HUVECs pretreated with IFN-γ (10 ng/mL) or IL-1β (1 ng/mL) for 4 h followed by incubation with CAP-NO (0, 1, 10 and 100 μM) for another 12 h. Band intensity was quantified by using Image Lab analysis software, and calculated as percentage of controls (IL-1β only). Bars represent the mean ± SEM (n = 3); *, P < 0.05, and ** P < 0.01.

