Figure 2.

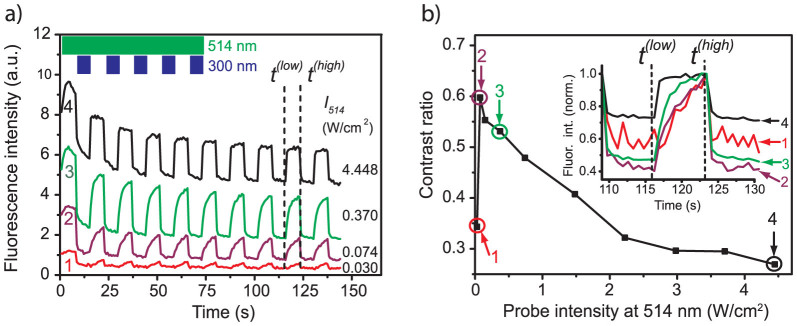
(a) Examples for the modulation of the fluorescence intensity as a function of the intensity of the probe beam at 514 nm. The intensity at 300 nm has been fixed to 0.124 W/cm2. The vertical axis has been normalised to 10 arbitrary units and is valid for trace 4. For better visibility traces 1 and 2 have been multiplied by a factor of 25 and trace 3 has been multiplied by a factor of 10. The inset top left shows the timing sequence of the conversion and the probe beams. The dashed vertical lines indicate the points in time that have been used to determine the contrast ratio of the fluorescence modulation, see text. (b) Contrast ratio of the fluorescence modulation determined at times t(low) and t(high) as a function of the intensity of the probe beam at 514 nm. The data points numbered 1–4 have been calculated from the corresponding traces shown in (a). The inset displays the normalised fluorescence intensity of the traces 1–4 from part (a) around the considered time interval.
