
Figure 4.
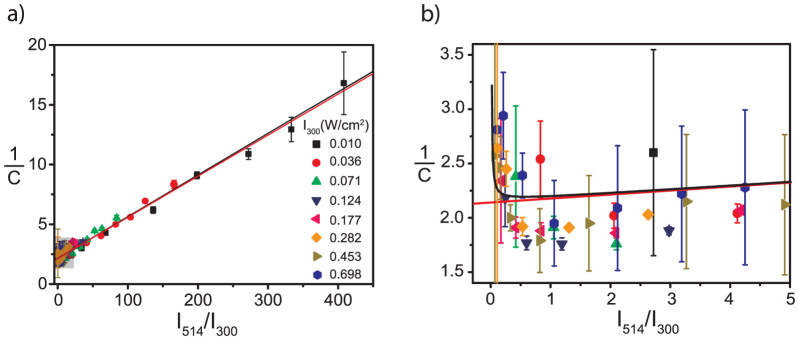
(a) Inverse fluorescence contrast ratio as a function of intensity ratio  . Different symbols refer to different absolute values of the excitation intensity at 300 nm. (b) An expanded view of the data for small
  ratios boxed in (a). The red line corresponds to a fit of the data using eq.(8) which yields b = 0.86(±0.08) and
  ; and the black line corresponds to a fit of the data using eq.(10) which yields b = 0.85(±0.08) and
  .
.