Figure 4.
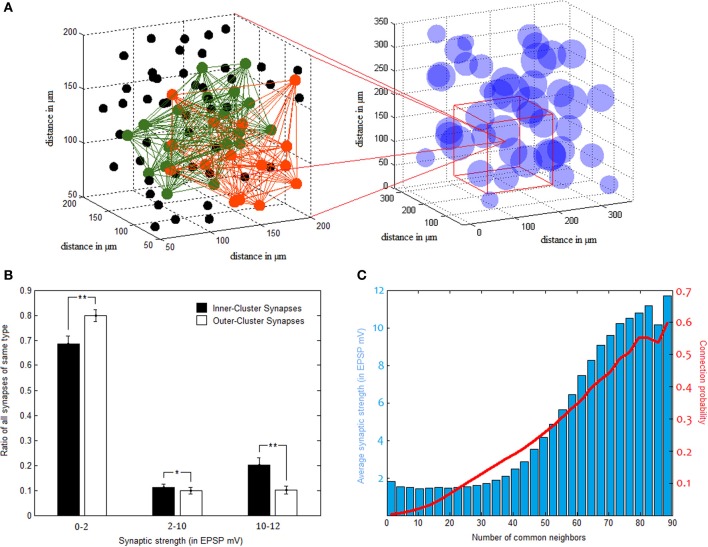
Pyramidal clusters. (A) Illustration of cluster overlap. On the right—cluster distribution in 3d space. Clusters are drawn as spheres using their calculated center point and average diameter. They overlap substantially, as can be seen zooming in to a region (on the left hand side). Two different clusters, colored green and orange, interlace in this space. Black dots indicate neurons which belong to neither of the two clusters. (B) Strong synapses constitute a larger fraction of inner-cluster synapses than outer-cluster synapses (STD bars shown in black. *p < 0.05, **p < 0.001). (C) Common neighbor rule. Both the probability to connect (in red) and the average connectivity strength (blue bars) rise as a function of the number of neighbors two PC neurons share.

