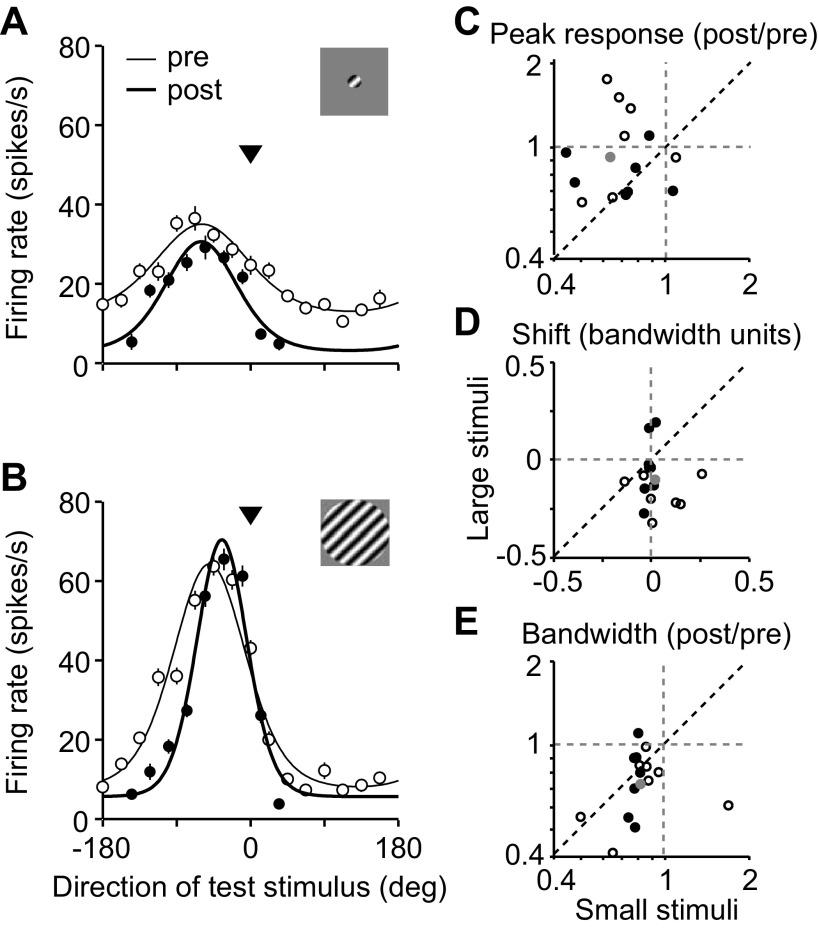
Fig. 3.
Adaptation effects in MT of awake macaque monkeys. A and B: direction tuning of an example MT unit before (open circles) and after (filled circles) 4-s adaptation with small (A) or large gratings (B). Data points are mean measured responses; error bars indicate SE. Solid lines are von Mises fits to the data. Arrowhead indicates the direction of the adapter. C: a comparison of the peak response ratio for responses to small and large gratings. Each open and filled circle represents data from an individual MT unit; gray circle indicates mean values. Filled circles indicate cells whose preference was within 1 bandwidth unit of the adapter. D: same as C for shifts in preference. E: same as C for bandwidth ratio.

