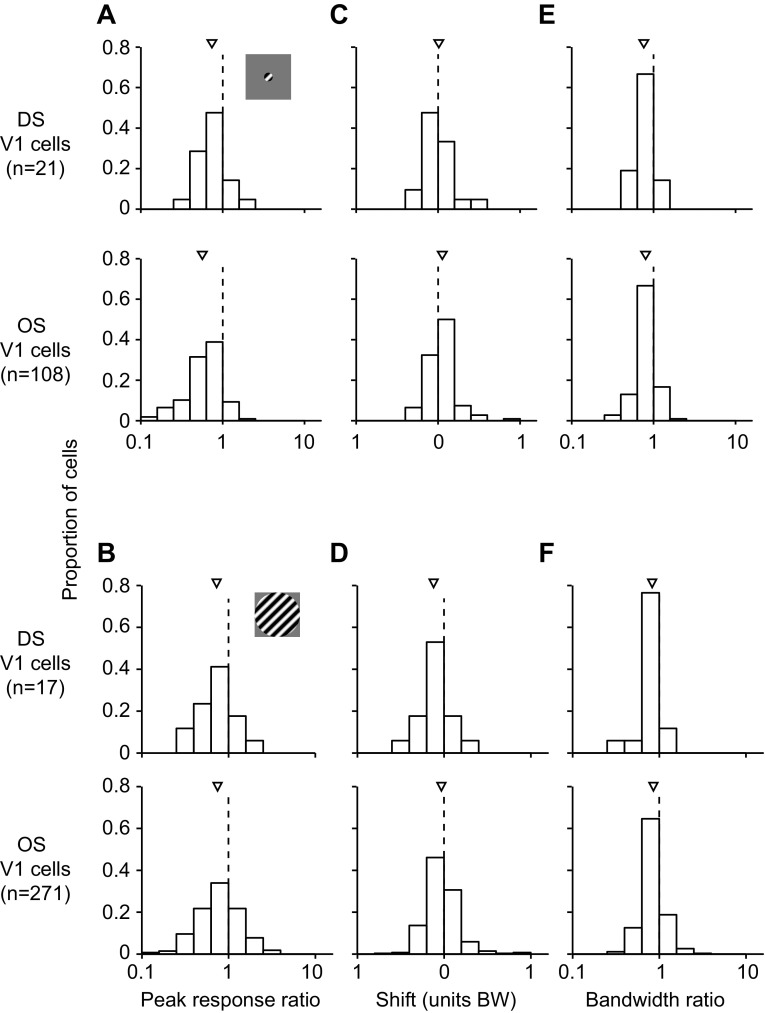
Fig. 6.
Comparison of prolonged adaptation (40 s) effects for V1 direction-selective (DS) and orientation-selective (OS) units whose preference was within 1 bandwidth unit of the adapter. A and B: peak response ratio measured with small (A) and large gratings (B). Data from DS units are shown at top and those from OS units at bottom. Arrowheads indicate mean values. C and D: shifts in preference for responses measured with small (C) and large gratings (D). E and F: bandwidth ratio measured with small (E) and large gratings (F).

