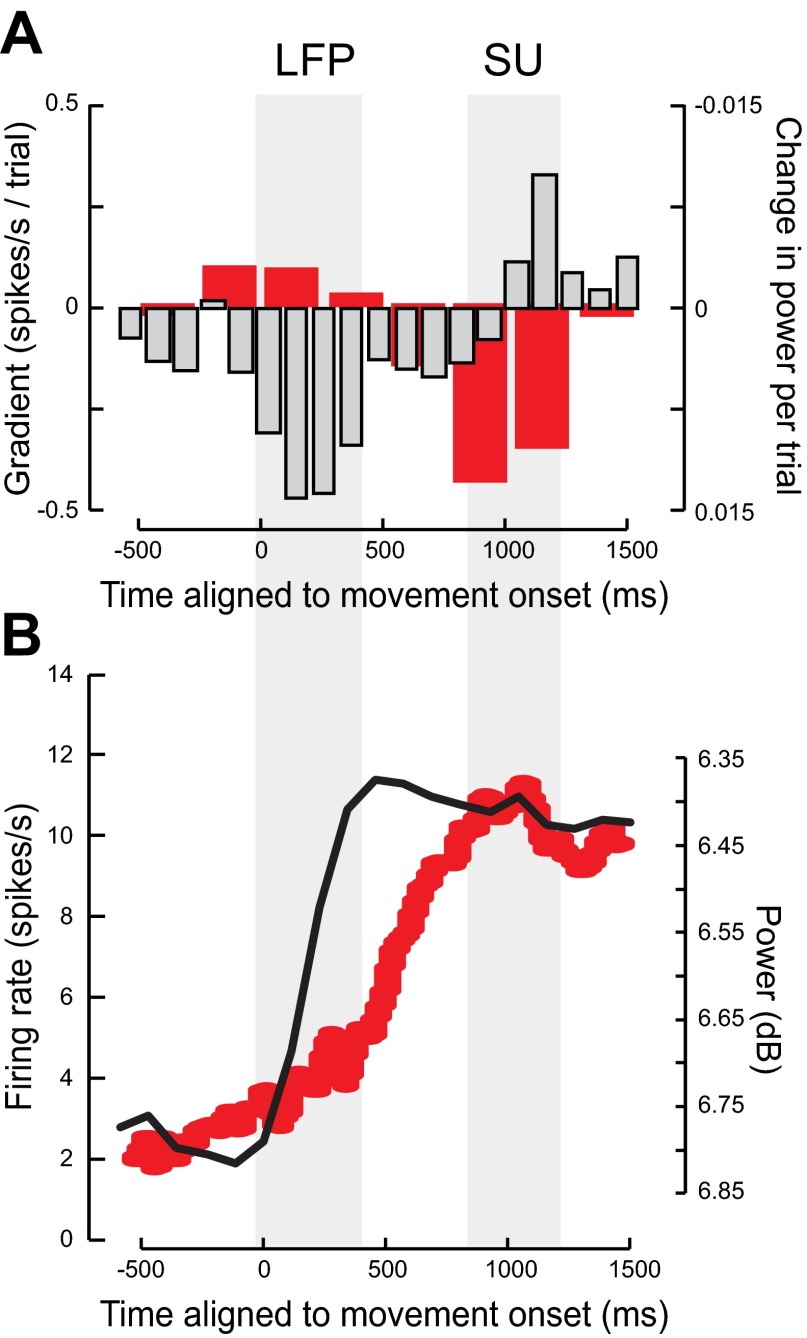
Fig. 11.
Comparison of LFP and mirror neuron firing rate data aligned to observed movement onset. A: average modulation in mirror neuron firing rate with repetition (red bars, y-axis on the left) and the average modulation of power in the 15- to 23-Hz band with repetition (light gray bars y-axis on the right). Note the sign of the power has been inverted for ease of comparison. The gray shaded areas show periods where there was a modulation in either the LFP power or single unit (SU) firing rate with repetition. B: average of the absolute difference in firing rate across all mirror neurons from a 500-ms premovement period (red line, y-axis on the left) and the average modulation in power in the 15–23 Hz compared with the average power in a 500 ms baseline window before the onset of the observed movement (black line, y-axis on the right). Note again the inversion of the LFP power scale.

