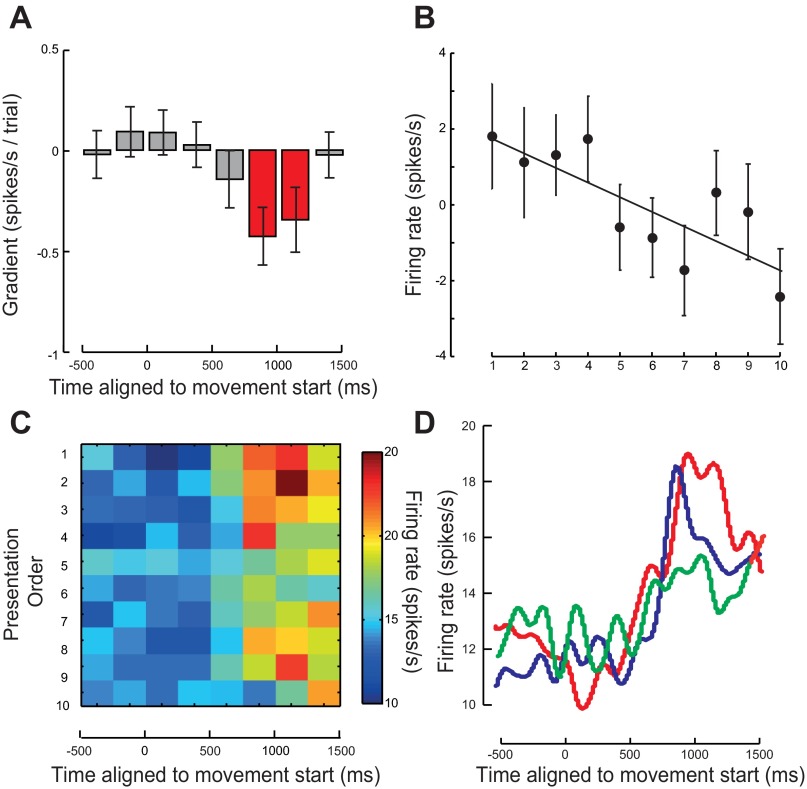
Fig. 6.
Modulation in mirror neuron firing rate when aligned to the time of observed movement onset. A: average rate of change of firing rate with repetition over 7–10 trials. A negative value indicates a firing rate decrease with repetition. Error bars show means ± SE. Time points where the data were significant are shown in red. B: average relative change in firing rate calculated from the mean firing rate averaged across mirror neurons for the 7–10 presentations of the observed action averaged for the 250 ms before the object being grasped. Error bars show means ± SE. C: average firing rate of all mirror neurons for each presentation. Presentation order is shown on the y-axis with repetitions increasing from top to bottom. D: average smoothed firing rate across all mirror neuron and averaged across presentations 1 and 2 (red line), presentations 3 and 4 (blue line), and presentations 5 and 6 (green line).

