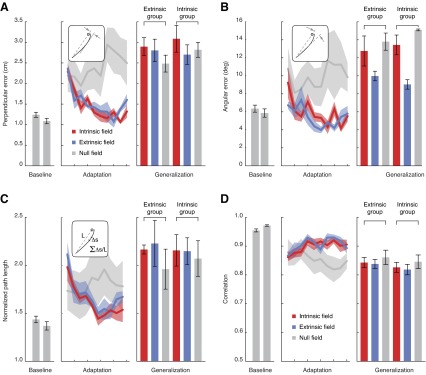
Fig. 13.

Subject performance during generalization trials in experiment 2: performance metrics of maximum perpendicular deviation from a straight reach to the target (A), angular deviation from a straight reach (B), normalized path length (C), and correlation with position and velocity of baseline reaches (D). Left: across-subject average measures during baseline (null field), averaged across extrinsic and intrinsic groups (gray bars show training workspace, then testing workspace; error bars are SEs). Center: 250-trial bins of adaptation for both groups along with the null field catch trials (averaged across both groups). Right: across-subject averages for generalization trials (error bars are SEs).
