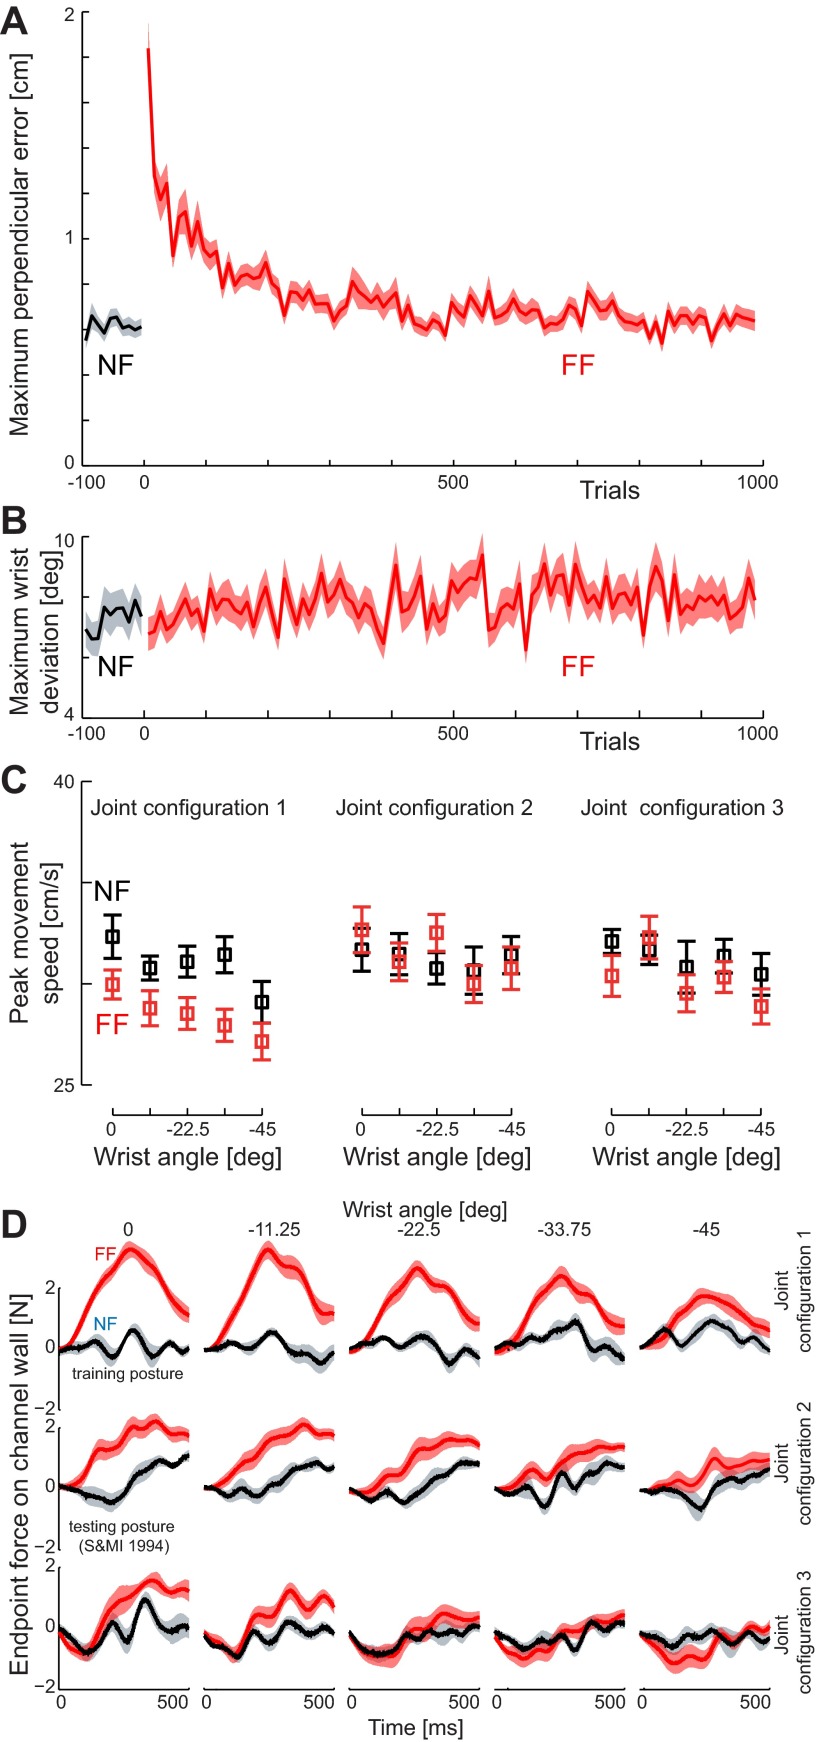
Fig. 4.
Learning of the force field dynamics in experiment 1. A: maximum perpendicular error (MPE) is plotted against the trial number for training movements in the initial null field (NF, black) and in the skew viscous force field (FF, red). The mean (solid line) and SE (shaded region) are shown across all subjects. B: mean peak wrist rotation (±SE) across all subjects is shown for the movements in the null field (black) and skew viscous force field (red) during the training movements. Note that no increase in wrist motion is seen when the force field is introduced. C: peak speed in the channel trials at each of the 15 test postures. The mean peak speed (±SE) across all subjects is shown for the movements in the null field (black) and skew viscous force field (red) during the test movements. Results are plotted as a function of the change in wrist angle rather than absolute hand orientation. D: force generalization. The mean (±SE) force trace during the channel movements is shown for movements in both prelearning (black) and late exposure (red) in the test movement trials.

