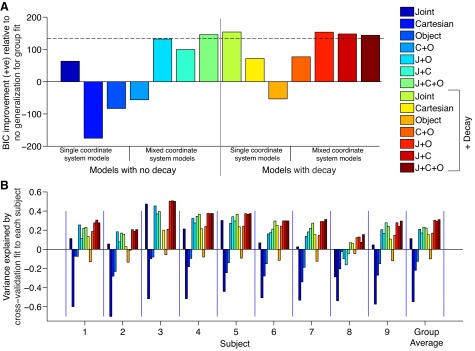
Fig. 7.

Model comparisons. A: Bayesian information criterion (BIC) improvement for each of the models relative to no generalization (that is, a model in which the force is zero at all the generalization postures). Dashed line shows the cutoff for models that are not considered to be distinguishable in terms of their performance from the best model. B: leave-one-out cross-validation analysis. For each subject we show the variance explained for each model when fit to the average of the remaining subjects' data. The final column shows the average of the variance explained across subjects. The model color code is as in A.
