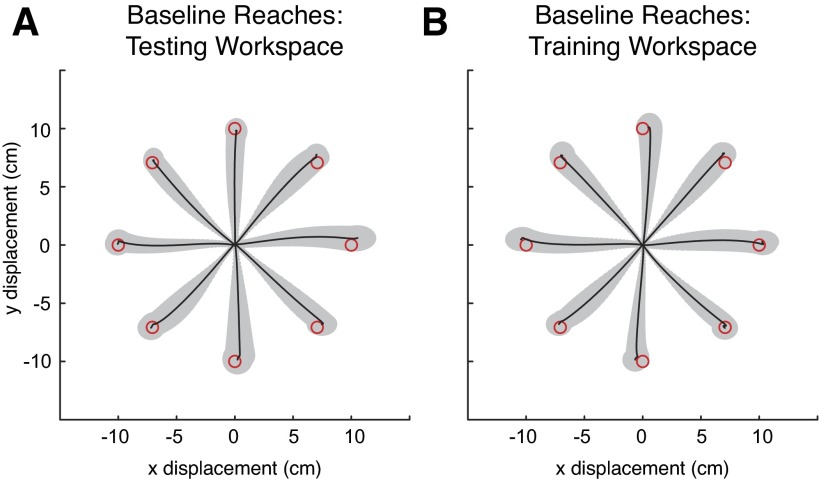
Fig. 8.
Average hand paths during baseline null field reaching in experiment 2. For each subject, the last 200 trials were processed accordingly: the starting location for each hand path was translated to the origin (in x and y) and then temporally aligned to the point in time where the velocity first reached the value of 0.1 m/s. These paths were sorted according to reach direction and feedback condition. Displayed are the across-subject averages and SDs of reaches made without visual feedback in the testing workspace (A) and the training workspace (B) along with the locations of the targets (drawn to scale).

