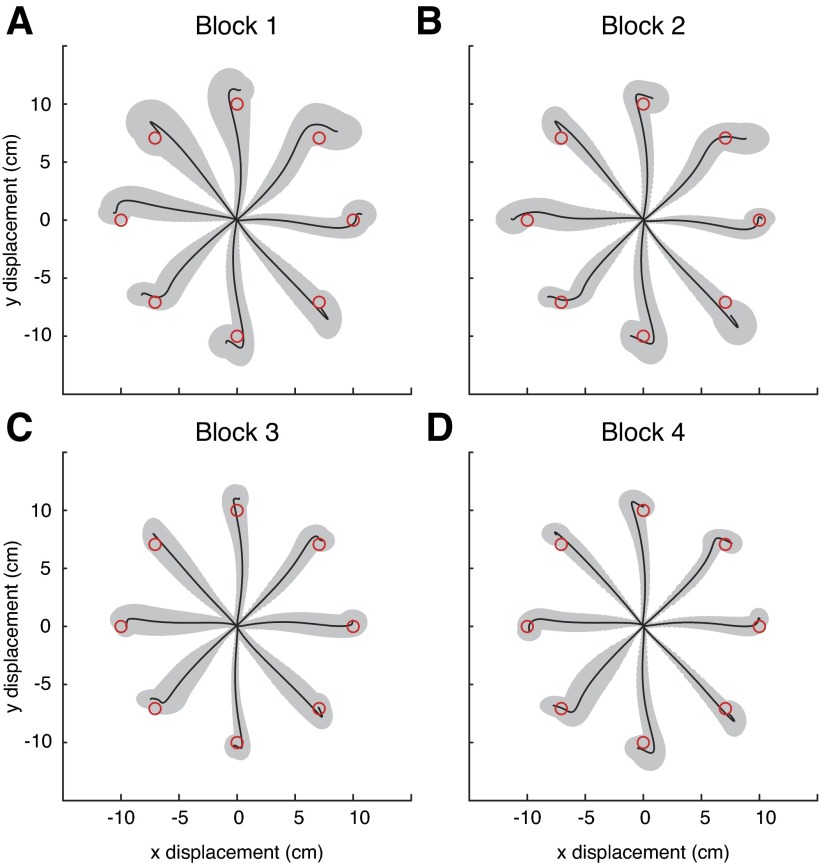
Fig. 9.
Average hand paths during adaptation trials in experiment 2. Similar to Fig. 8, using all 1,000 trials of adaptation, paths were translated to the origin, temporally aligned, and sorted according to target and feedback condition and force field. Displayed are the across-subject averages for no-vision, force field trials during the first (A), second (B), third (C), and last (D) 250 trials of adaptation.

