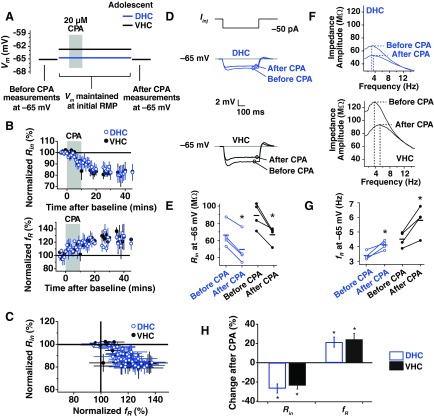
Fig. 2.
SD h plasticity in dorsal and ventral hippocampal (DHC and VHC, respectively) neurons from adolescent animals. A: current was injected to maintain the cell at the voltages used in each portion of the plasticity experiment. Before-CPA measures (Rin and fR) were made at −65 mV. Neurons were then returned to their RMP and maintained there for the subsequent 40- to 60-min recording period. Black and blue lines indicate average, initial RMP values for VHC and DHC neurons, respectively. Neurons were again held at −65 mV at the end of the experiment to collect after-CPA measurements. B: the time course of change in normalized Rin and fR for DHC and VHC neurons. C: percent change in normalized Rin vs. normalized fR. D: representative before- and after-CPA traces for the measurement of Rin. Voltage traces shown are responses to a −50 pA Iinj. E: before- and after-CPA measurements of Rin (at −65 mV) for all cells. In this and subsequent figures: blue (open circles) indicates data from DHC neurons, and black (closed circles) indicates data from VHC neurons; horizontal bars indicate average values; and asterisks indicate statistical significance with a paired statistical test (P < 0.05). F: representative before- and after-CPA impedance traces (performed at −65 mV). G: before- and after-CPA measurements of fR (at −65 mV). H: average percent changes after CPA (for measures made at −65 mV) for reduction in Rin and increase in fR. In this and subsequent figures of this type: blue bars indicate data from DHC neurons, and black bars indicate data from VHC neurons; asterisks indicate statistical significance (P < 0.05) when a paired test was performed on the ordinate data before and after CPA; and error bars are SE.

