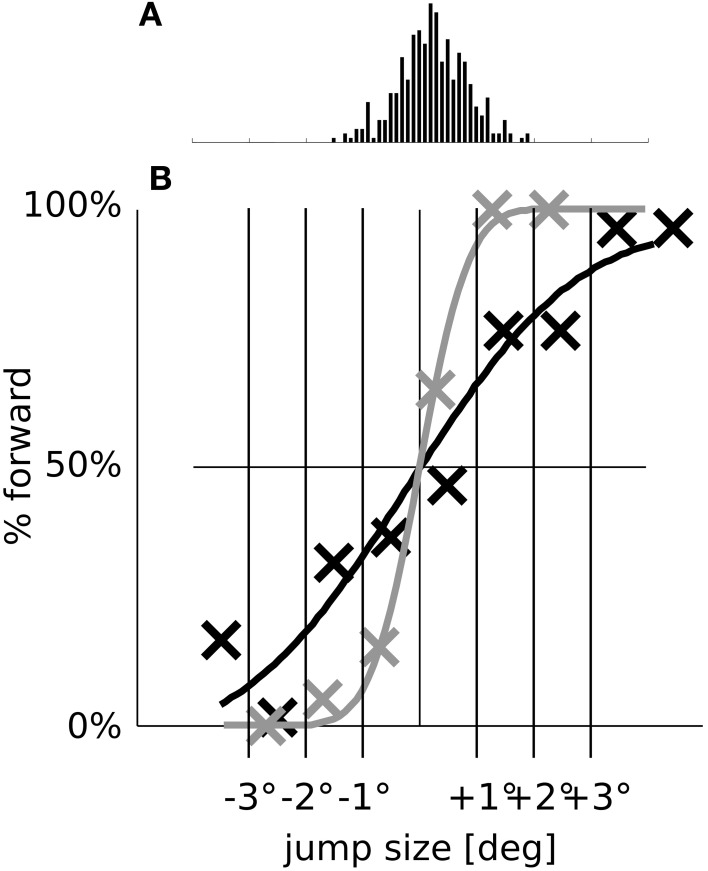
Figure 9.
The SSD effect in relation to saccadic scatter. (A) Histogram of the saccade endpoint with removed bias (in the simulations, the saccades undershoot by 0.52° on average). (B) For better comparison, we replot the psychometric detection curves of the full model (dark line) and of the model without remapping (gray line) from Figures 7A,B with the biases removed.

