
FIGURE 3.
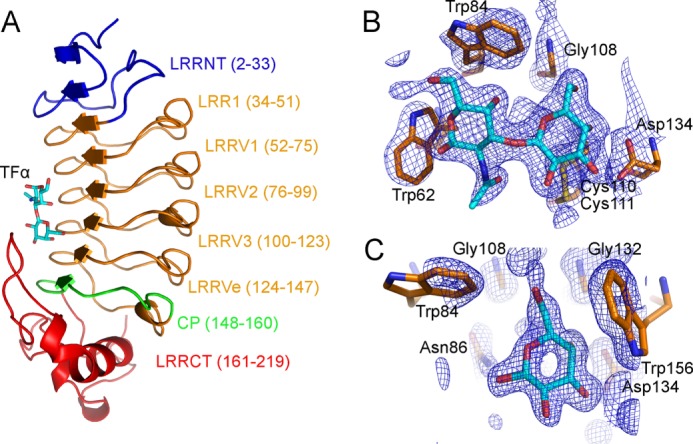
Structure of the VLRB. aGPA.23-TFα complex. A, a ribbon diagram of the VLRB.aGPA.23-TFα complex shows the concave antigen binding surface of the VLR solenoid. Blue, LRRNT; orange, LRR1, LRRV1–3, and LRRVe; green, CP; red, LRRCT. Carbons, nitrogens, and oxygens of TFα are cyan, blue, and red, respectively. B, electron density from the final 2Fo − Fc map (contoured at 1σ) of VLRB.aGPA.23-TFα at 2.2 Å resolution shows the Galβ1–3GalNAcα1 moiety of TFα. C, electron density from the final 2Fo − Fc map (contoured at 1σ) of the VLRB.aGPA.23-BG-H complex at 1.7 Å resolution show of the galactose moiety of BG-H. RU, relative units.