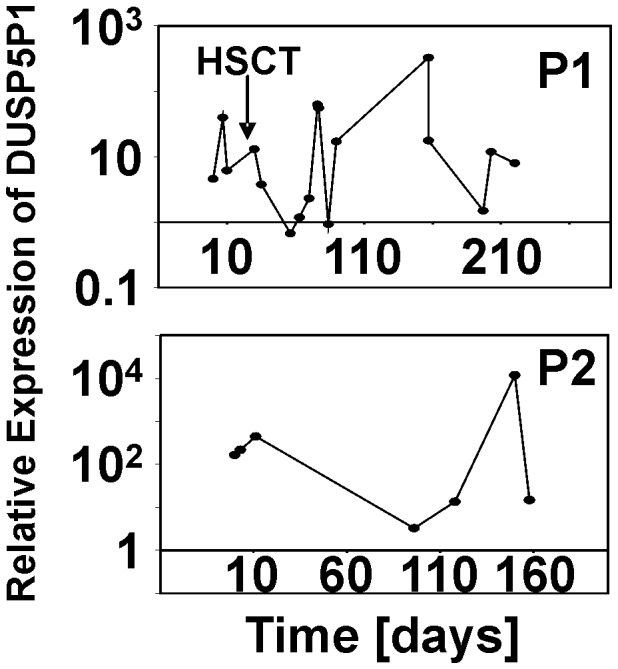
Figure 7. Time course of DUSP5P1 expression in the blood of refractory HL patients.

Quantitative RT-PCR was used for determination of expression of DUSP5P1 in PBMCs from two HL patients (P1 and P2). The date of first sampling was set as time point 0. For calculation of relative expression values, GAPDH was used as housekeeping control and the mean Δct value from 5 PBMC samples from healthy donors was set as 1. Patient #1 was treated with hematopoietic stem cell transplantation (HSCT) at the indicated time point.
