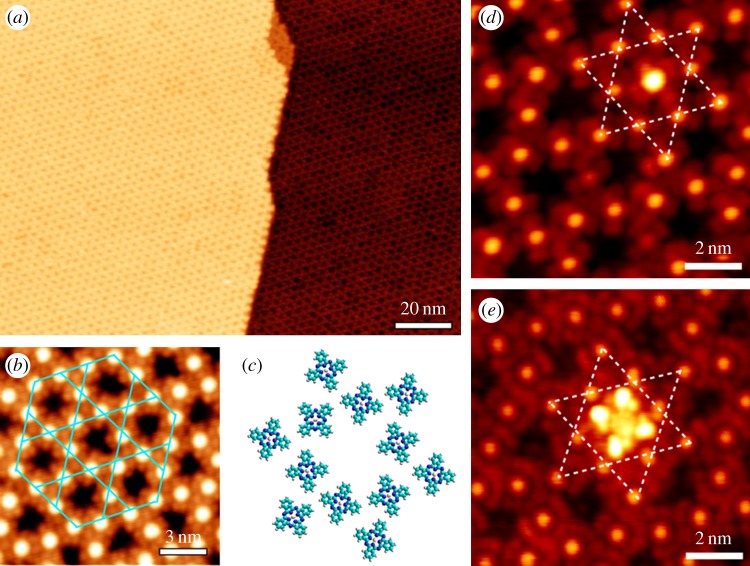
Figure 4.
(a) Large-scale STM image of the kagome lattice of FePc. (b) Zoom-in image showing the details of the kagome lattice of FePc. The unit cell of the kagome lattice is marked with blue solid lines. (c) Structural model of the kagome lattice showing molecular orientation disorder. (d,e) STM images of single-guest FePc and (t-Bu)4–ZnPc molecules hosted by FePc kagome lattice, respectively. Dashed lines highlight the underlying kagome lattice. (Online version in colour.)

