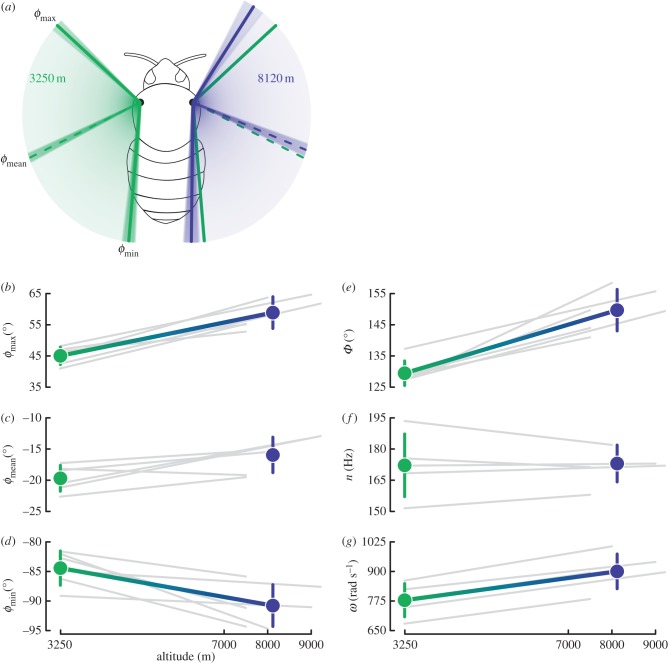
Figure 2.
Changes in stroke angles during bumble-bee flight at simulated high altitude. (a) Dorsal view of a hovering bee with means (solid lines) and standard deviations (shading around lines) of wing positions at 3250 m (left wing in green) and 8120 m (the average maximum altitude, right wing in blue). The wing positions for 3250 m are also shown in green on the right wing to facilitate comparison. Maximum, mean and minimum wing positional angles (b,c and d, respectively) and stroke amplitude, wingbeat frequency and angular velocity (e,f and g, respectively), for flight at capture and maximum simulated altitudes. Grey lines indicate data for individual bees and coloured points and lines indicate averages among all bees. Lines are only shown for variables that changed significantly between altitudes (table 1).

