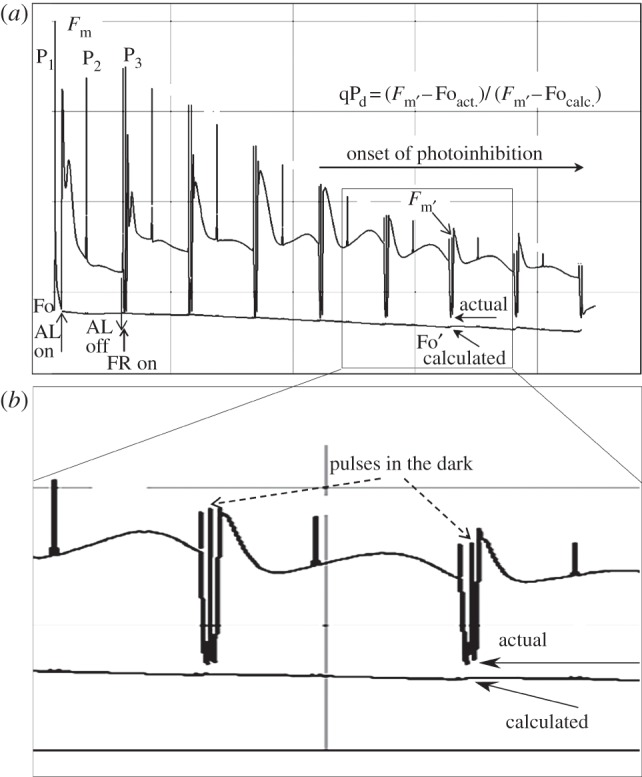
Figure 1.

(a) Scheme of induction of chlorophyll fluorescence quenching in a wild-type Arabidopsis leaf as used in figure 2, with constant actinic light, or by eight stepwise increasing actinic light levels (figures 3–8): 90, 190, 285, 420, 620, 820, 1150 and 1500 μmol m−2 s−1. Vertical arrows on the left of the figure indicate application (AL on) and removal (AL off) of the actinic light treatment. P1, P2, P3 are saturating pulses applied before (P1) and during (P2, P3) the actinic light treatment. Short arrows on the right of the figure indicate levels of calculated ( ) and actual (
 ) fluorescence in the dark. (b) The zoomed region of the fluorescence trace indicates the two brief dark breaks between the illumination steps where saturating pulses have been applied to enable calculation of the qPd parameter (the equation is shown in the figure panel). The timing scheme for the dark breaks was: (AL off) (FR on)-(7 s)-(P)-(5 s)-(AL on)(FR off), where FR is far-red light; P is the saturating pulse.
