Figure 4.

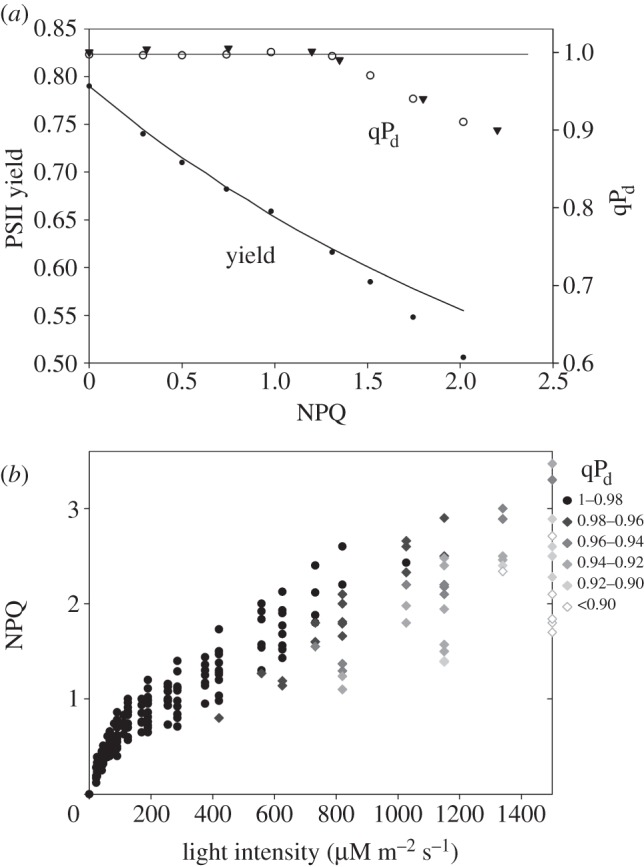
(a) The relationships between PSII yield/qPd and NPQ derived from the measurements on wild-type Arabidopsis leaves using the scheme presented in figure 1. Closed triangles correspond to the measurement on lincomycin-infiltrated leaf (see §2 Material and methods). (b) The relationship between NPQ, actinic light intensity and qPd derived from the measurements using figure 1 scheme on 35 leaves. The legend on the right explains the qPd scale of the grey shading of diamond symbols in order to reflect the extent of photodamage. For other details, see §3b.
