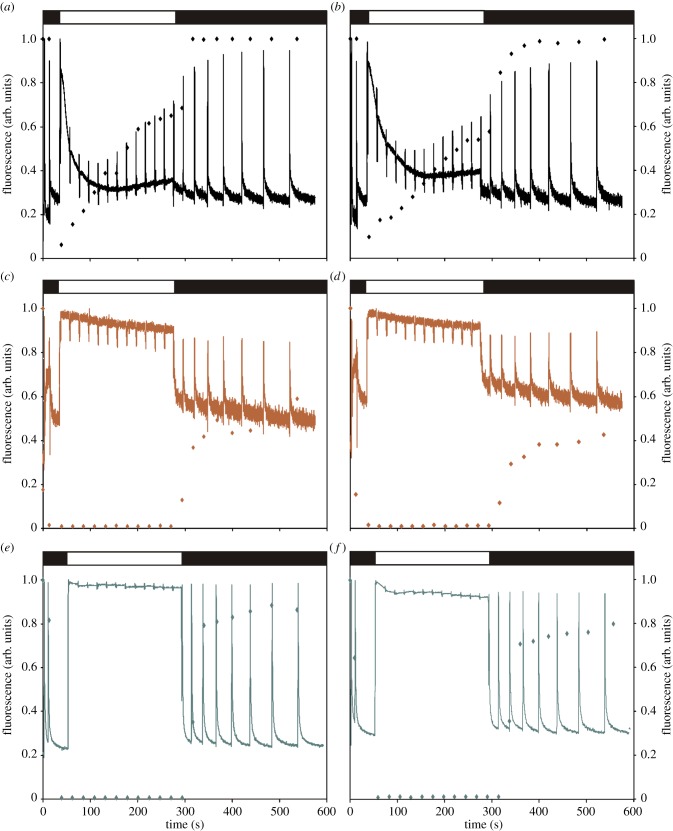
Figure 2.
Changes in electron flow measured through chlorophyll a fluorescence and the qL parameter following 3 h treatment with DCMU and DBMIB in wild-type (a,c,e) and in the rao1.1 mutant (b,d,f). Fluorescence traces (filled lines) and qL (symbols) in (a,b) untreated control plants, (c,d) in response to 50 µM DCMU and (e,f) in response to 100 µM DBMIB. Black and white boxes above the curves represent absence or presence of actinic light (135 μmol m−2 s−1) during the measurements. Data represent mean from at least three independent biological replicates.

