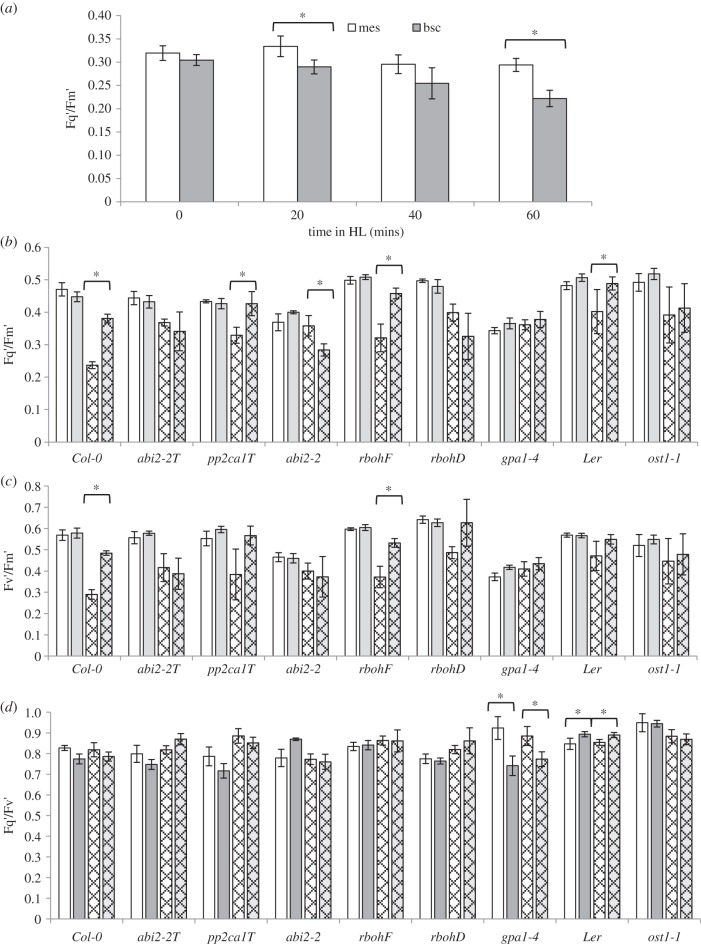
Figure 2.
Cell-specific chlorophyll fluorescence (Cf) parameters under HL and LL. (a) Plants were exposed to HL (1500 µmol m−2 s−1 PPFD) for 0, 20, 40 and 60 min, and then individual detached leaves were placed under a high-resolution Cf imaging system (see Material and methods) and Fq′/Fm′ determined for six different cells of BSC (grey bars) and mesophyll (white bars) per leaf from three plants (n = 18). (b–d) Fq′/Fm′ (b), Fv′/Fm′ (c) and Fq′/Fv′ (d) Cf parameters (mean ± s.e.) from HL-exposed bundle sheath and mesophyll cells (white checked bars and grey checked bars, respectively) and their corresponding LL controls (white bars and grey bars) of wild-type and ABA-signalling mutants. Plants were exposed to HL for 60 mins as in (a), and then individual detached leaves were imaged as in (a). Cf data were collected for six different cells of each type per leaf from three plants (n = 18). From these data, Fq′/Fm′ (b), Fv′/Fm′ (c) and Fq′/Fv′ (d) were calculated. In all panels a–d, pairs of columns marked with an asterisk (*) mean that the comparison is significant at p ≤ 0.001 (Student's t-test). The words abi2-2T and pp2ca1T are for the abi2-2/abi1-2/hab1-1 and pp2ca1-1/abi1-2/hab1-1 mutants, respectively.

