FIGURE 2.
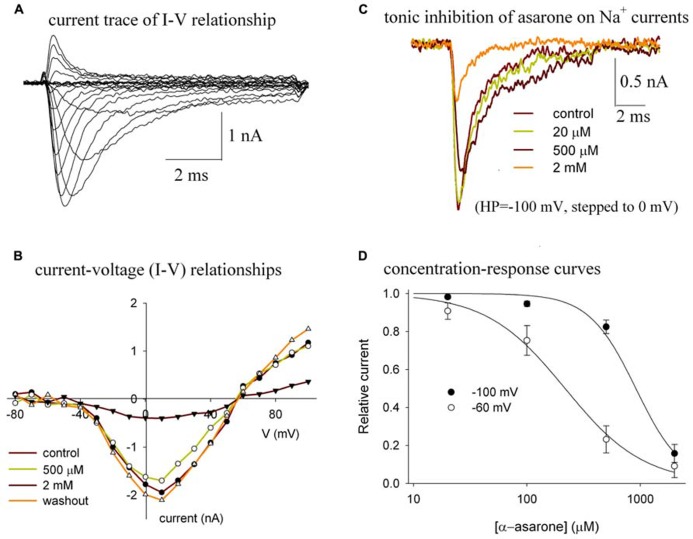
(A–D) Tonic inhibition of α-asarone on Nav1.2 channels. (A) The current traces of Nav1.2 illustrate the current–voltage (I–V) relationship of the channel. (B) The I–V relationships in control and in the presence of various concentrations of asarone. The currents were elicited by stepping to various depolarized potentials (ranging from – 80 to +100 mV in 10-mV increments) for 9 ms, and then returning to the holding potential of –100 mV. Peak currents at each depolarized potential were measured. The data are from a representative cell. (C) Superimposed current traces recorded before (control), during the application of 20 μM, 500 μM, and 2 mM α-asarone. The currents were recorded from the same cell and were elicited by a 10-ms pulse to 0 mV from the -100 mV holding potential. (D) Concentration–response curves for the inhibition of Na+ currents by α-asarone at different holding potentials. The cells were held at –100 mV, and –60 mV, respectively, and stepped to 0 mV for 10 ms. The peak currents in the presence of asarone were normalized to the corresponding control peak currents, and then averaged. Each point was the mean ± SEM of 4–6 cells. The lines are best fits for data to the Hill equation: y=1-xn/(Kdn+xn), where y is the fractional current, Kd is the apparent dissociation constant for asarone, and n is the Hill coefficient. Kd and n were estimated using a Marquadt non-linear least-squares routine.

