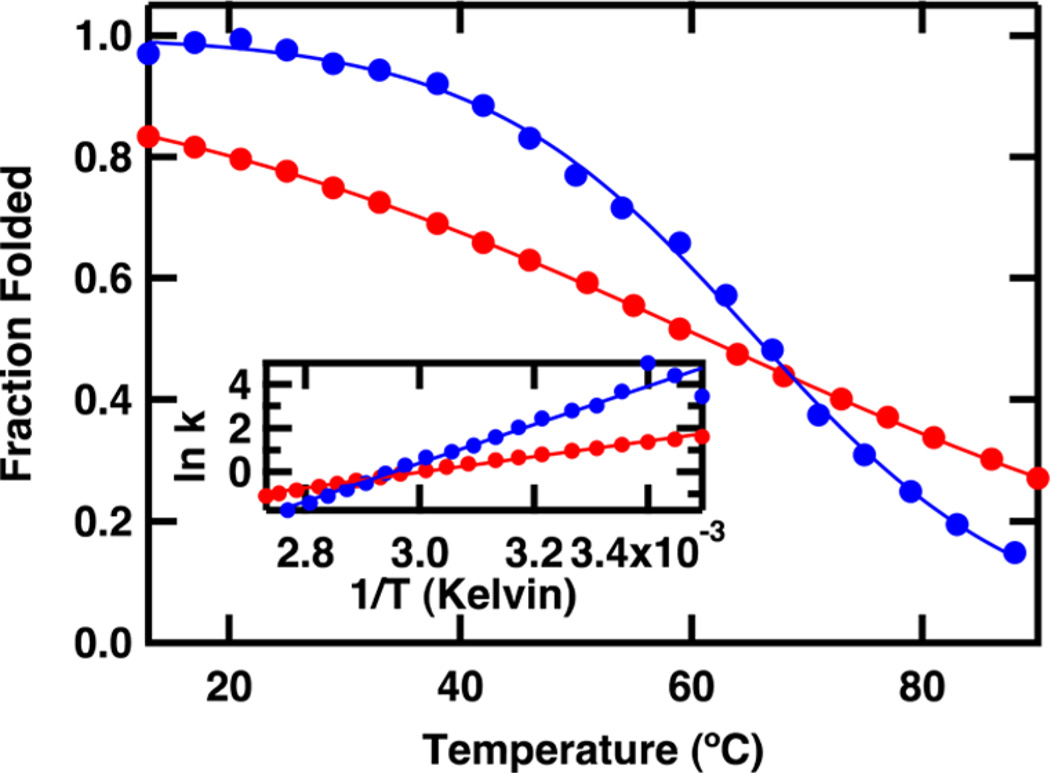
Figure 4.
FTIR melt curves for the FBP28 1L (red) and FBP28 2L (blue) WW domains obtained by plotting the change in IR difference spectra at 1634 cm−1 versus temperature. The data are fit to an apparent 2-state model (eq 2) and then normalized. Inset: van’t Hoff analyses using equilibrium constants generated from the melt curves.

