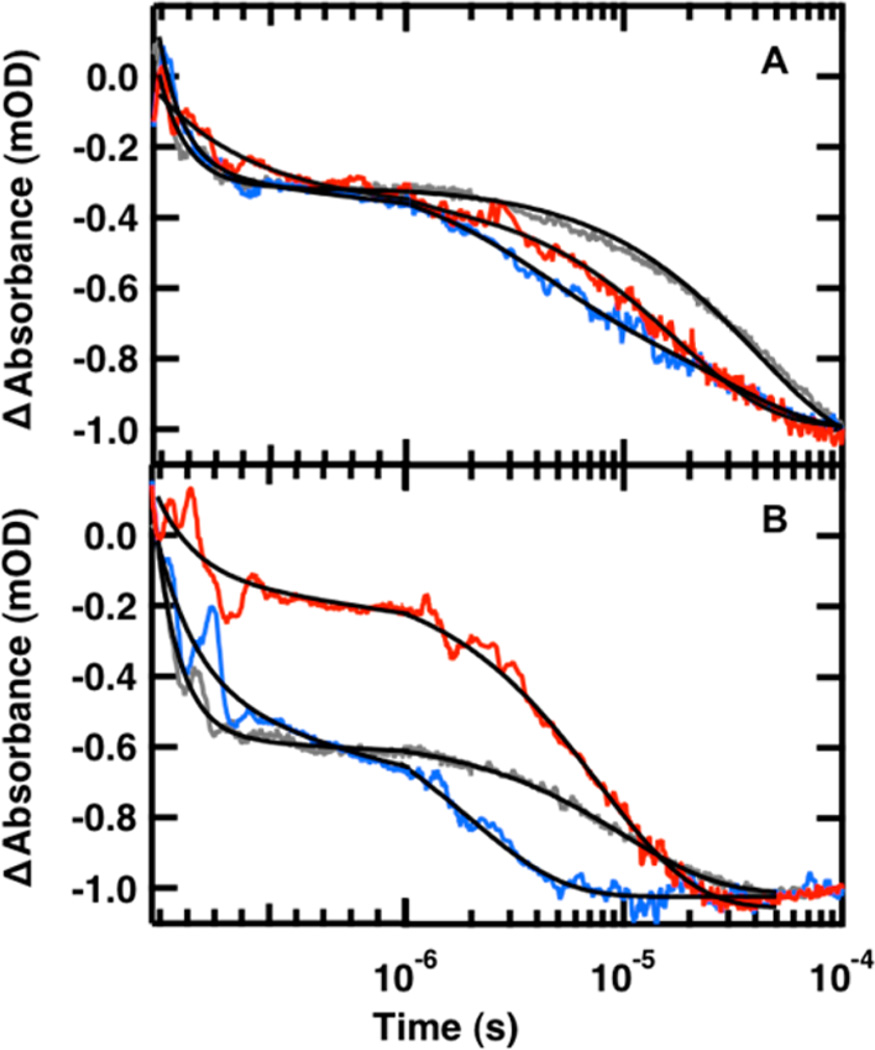
Figure 5.
Representative IR T-jump relaxation kinetics of FBP28 1L (red), FBP28 2L (blue) and wild type FBP28 (gray) monitored in the amide I′ spectral region at 1633 cm−1 following a T-jump from (A) 30 to 45 °C and (B) 50 to 65 °C. A triple exponential fit, eq 1, is overlaid on each kinetic trace on top and a double exponential fit is overlaid on each kinetic trace on the bottom (black solid line). The data are normalized at 1 × 10⁻⁴ for comparison.

