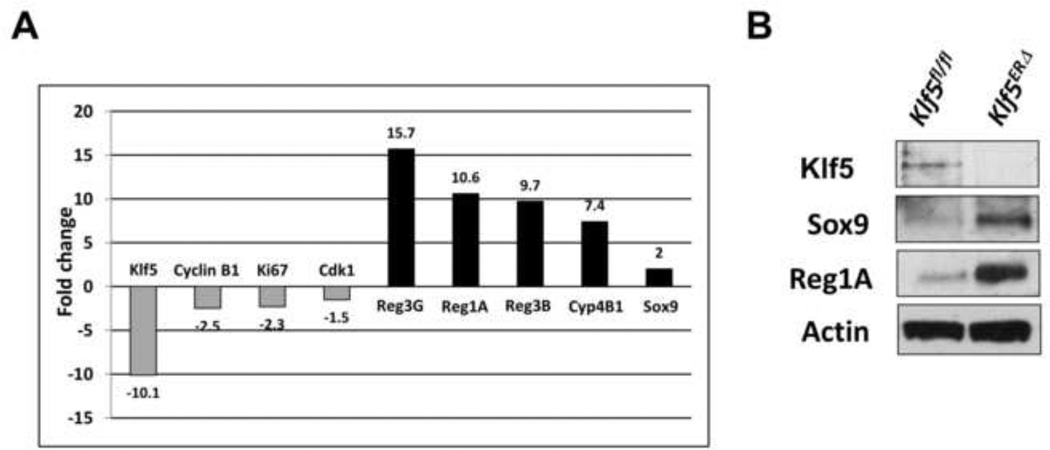
Figure 6. Quantitative PCR and Western blot analyses confirm the up/down-regulation of microarray-selected Klf5 targets.
Quantitative PCR was performed on day 3 tamoxifen-treated RNAs as discussed in Methods. The results contained in Panel A show that Klf5, Ki-67, cyclin B1 & Cdk1 were several folds down-regulated when compared to the controls, while Reg3G, Reg1A, Reg3B, Cyp4B1 and Sox9 were up-regulated. Panel B represents immunoblot analyses of Klf5, Sox9, Reg1A and actin. Lane 1 represents control Klf5fl/fl colon lysates and lane 2 represents Klf5ERΔ samples. Actin was used as a loading control.

