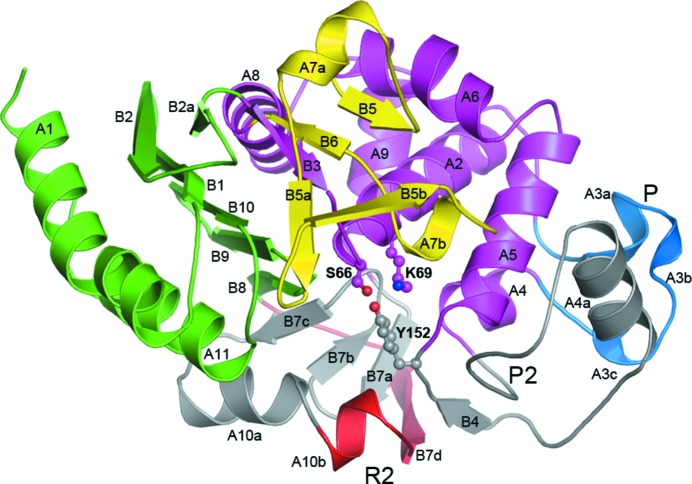
Figure 2.
Ribbon representation of ADC-1. The structure is colored according to the two major structural domains: domain 1 in green and domain 2 in magenta. The Ω-loop (yellow), the P-loop (blue), the R2-loop (red) and the P2-loop are also indicated. The parts of the structure in gray (including the R2-loop) represent the additional residues present in the class C enzymes relative to the smaller class A and class D enzymes. The three catalytic residues (Ser66, Lys69 and Tyr152) are shown in ball-and-stick representation.

