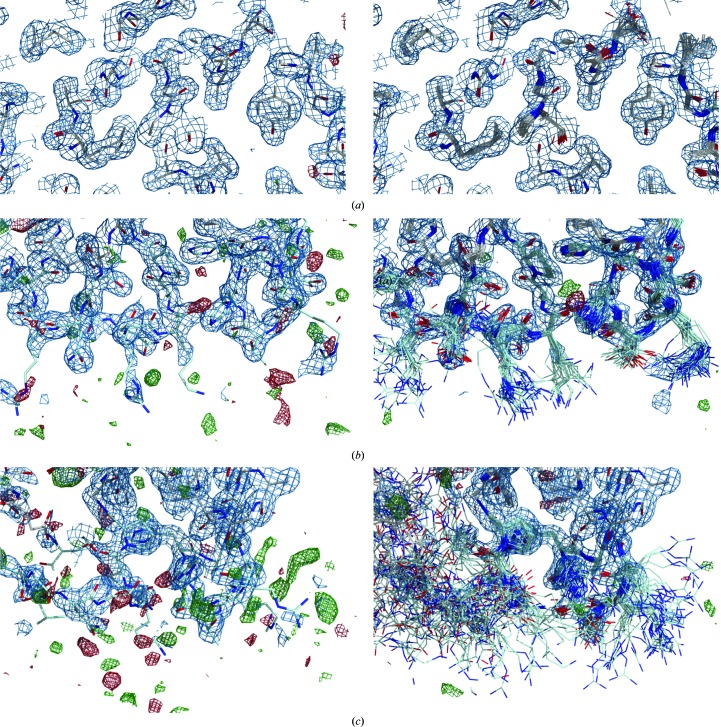
Figure 1.
Comparison of electron densities for the FD R202A (R218A) structure at 1.8 Å resolution refined using conventional refinement (left) and ensemble refinement (right). Shown are (a) an ordered region in the core of the FD molecule, (b) the exosite region for chain B of the asymmetric unit, showing disordered side chains for the surface-exposed residues, (c) the exosite region for chain A of the asymmetric unit, showing poorly defined electron density for the main chain resulting in large displacements of the ensemble models. The panels show the 2mF o − DF m map (blue) contoured at 0.38 Å e−3 (1.00σ) and the mF o − DF m map (green and red) contoured at ±0.31 Å e−3 (±2.45σ for standard refinement, ±3.01σ for ER).

