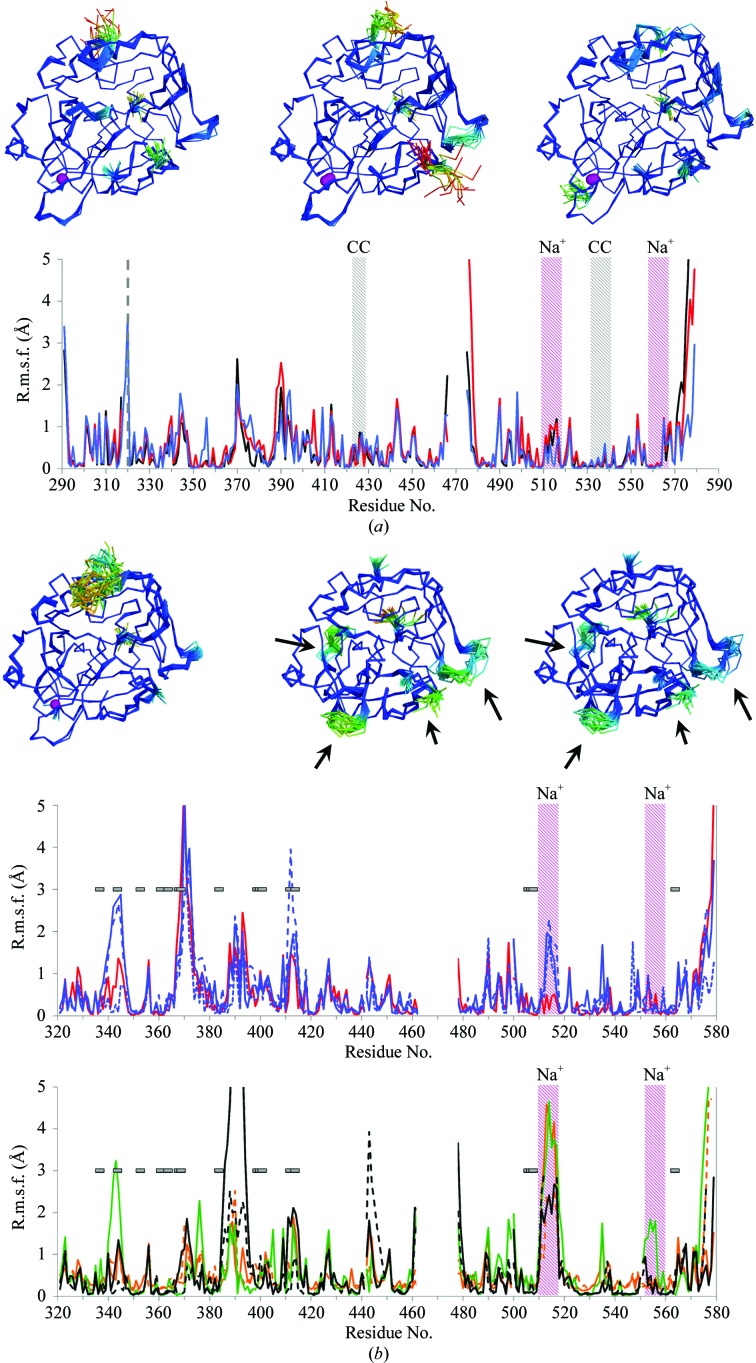
Figure 4.
ER of thrombin crystal structures. (a) Thrombin ensembles obtained from ER of data sets of thrombin in complex with PPACK derivatives (Figueiredo et al., 2012 ▶): d-Phe-Pro-d-Arg-Cys-CONH2 (original PDB entry 3u8t, black), d-Phe-Pro-d-Arg-Ile-CONH2 (original PDB entry 3u8r, red) and d-Phe-Pro-d-Arg-Thr-CONH2 (original PDB entry 3u8o, blue). Models are coloured by r.m.s.f. from blue through green to red. The bound sodium ions are shown as purple spheres. In the r.m.s.f. plots, the grey dashed line indicates the separation between thrombin light and heavy chains. Coloured areas indicate the sodium-binding loops (Na+, purple) and the regions involved in crystal-packing contacts (CC, grey). (b) Ensembles and r.m.s.f. plots for wild-type Na+-bound thrombin (original PDB entry 3u69) and the two monomers observed in the asymmetric unit of wild-type Na+-free thrombin (original PDB entry 2afq). Models are coloured by r.m.s.f. from blue through green to red. The bound sodium ions are shown as purple spheres. The histograms show Na+-bound wild-type thrombin (original PDB entry 3u69, red) and the S183A mutant (original PDB entry 1jou, blue) (top) and Na+-bound wild-type thrombin (original PDB entry 2afq, black), the E217K mutant (original PDB entry 1rd3, orange) and the D102N mutant (original PDB entry 3bei, green) (bottom). Purple areas indicate the Na+-binding loops. For structures with multiple copies in the asymmetric unit, solid lines are shown for chains A and B, dashed lines for chains C and D, and dotted lines for chains E and F. Arrows and horizontal bars indicate regions with observed significant chemical shift differences (≥0.1 p.p.m.) during the transition from Na+-bound to Na+-free thrombin according to Lechtenberg et al. (2010 ▶).

