
Fig. 3.
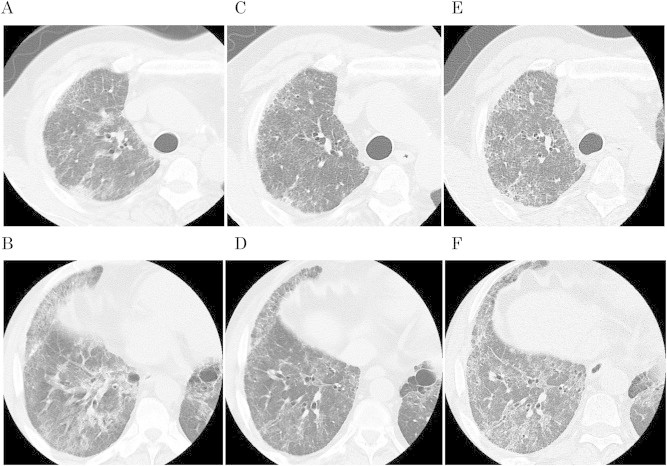
A–B, CT scan of right lung at time of admission. C–D, same slices of right lung 2 months later, showing improvement of ground-glass opacity and reticulonodular pattern as the result of treatment. E–F, same slices of right lung at 1 year after admission, showing gradual progression of disease.