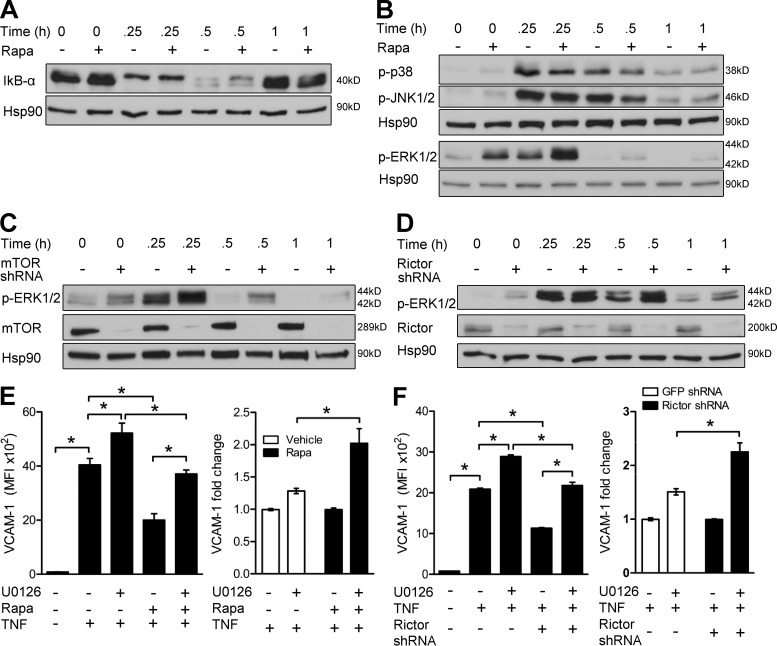
Figure 2.
Rapamycin inhibition of mTORC2 reduces VCAM-1 expression by hyperactivating ERK1/2. (A and B) Western blot analysis of control- or rapa-ECs stimulated with TNF for the indicated times. (C and D) Western blot analysis of ECs transduced with the indicated shRNA and treated with TNF for the indicated times. (E) ECs pretreated with rapamycin and/or U0126 were stimulated with TNF and analyzed by FACS. Left panel shows MFI of VCAM-1 staining. Right panel shows induction of VCAM-1 by U0126 relative to vehicle- or rapa-ECs not exposed to U0126. (F) ECs transduced with the indicated shRNA were pretreated with U0126, stimulated with TNF, and then analyzed by FACS. Left panel shows MFI of VCAM-1 staining in a representative experiment (n = 3). Right panel shows pooled data comparing fold induction of VCAM-1 by U0126 relative to control- or rictor-knockdown ECs not exposed to U0126. For A–D, similar results were seen in two independent experiments. Means ± SEM are shown for data pooled from two (E [n = 9] and F, right [n = 6]) independent experiments (n = total replicates). For E and F, significance was determined by ANOVA with Tukey’s post-hoc test. *, P < 0.05.

