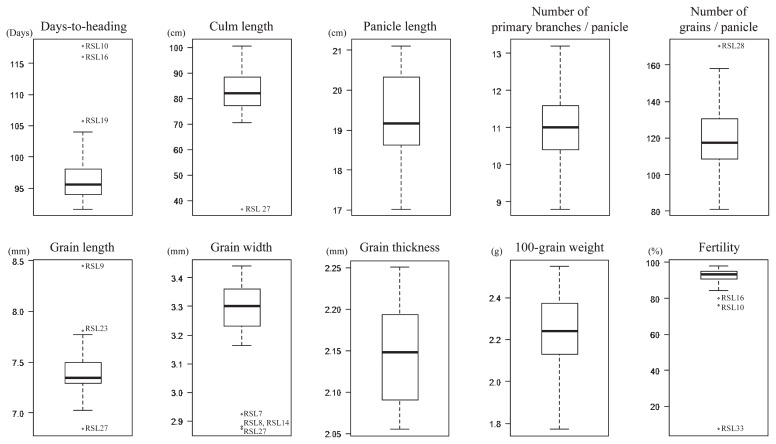
Fig. 3.
Boxplots of the mean values for each trait. Boxplots for all traits measured in this study were shown. Dots in boxplots indicate outliers showing mean values that are significantly different from others. These outliers were identified as RSLs that have a chromosome segment harboring a major effective QTL derived from O. rufipogon.

