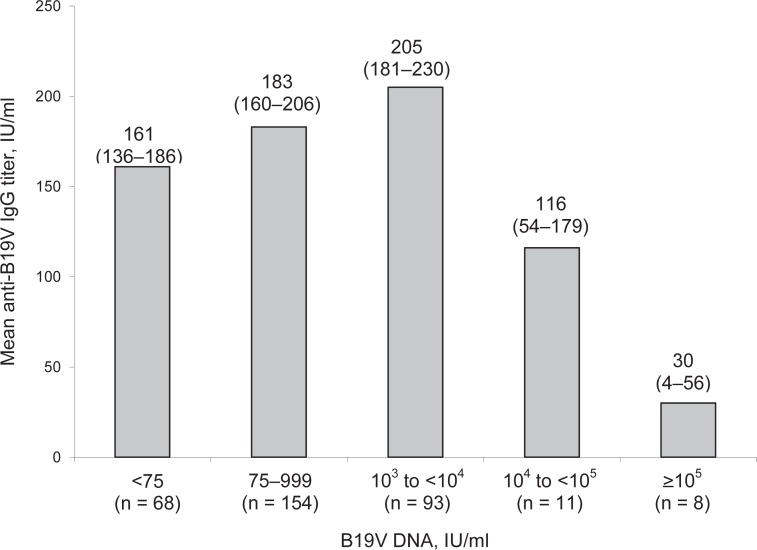
Fig. 2.
Mean anti-B19V IgG titer in relation to the B19V DNA concentration of 334 samples. In 13 samples, antibody titer was not determined. The numbers in parentheses below the DNA concentration give the number of investigated samples in each group. The numbers at the top of the columns give the mean anti-B19V IgG titer, and (in parenthesis) the 95% confidence intervals.

