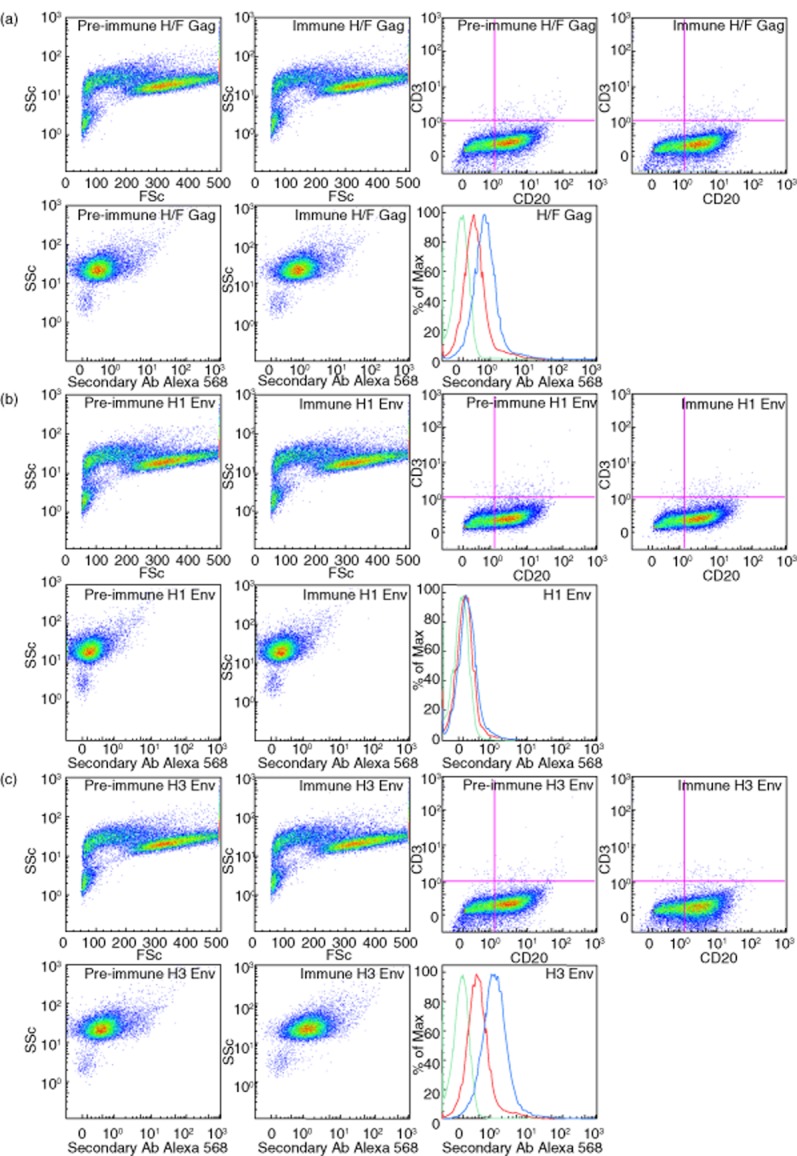
Figure 2.

Differences in relative proportions of CD56bright and CD56dim natural killer (NK) cell populations in the effector cells. Fluorescence activated cell sorter (FACS) profiles shown as pseudo-colour plots illustrating the relative proportions of CD56bright and CD56dim NK cell populations in each of the 10 effector cells (a–j). For each effector cell the four panels are, from left to right: far left: ungated [side scatter (SSc) versus forward scatter (FSc]; left: lymphocyte gate (CD56 versus CD3); right, and far right: the populations representing CD56bright cells are boxed and depicted as both the CD3−CD56+ population (right) and in relation to FSc (far right).
