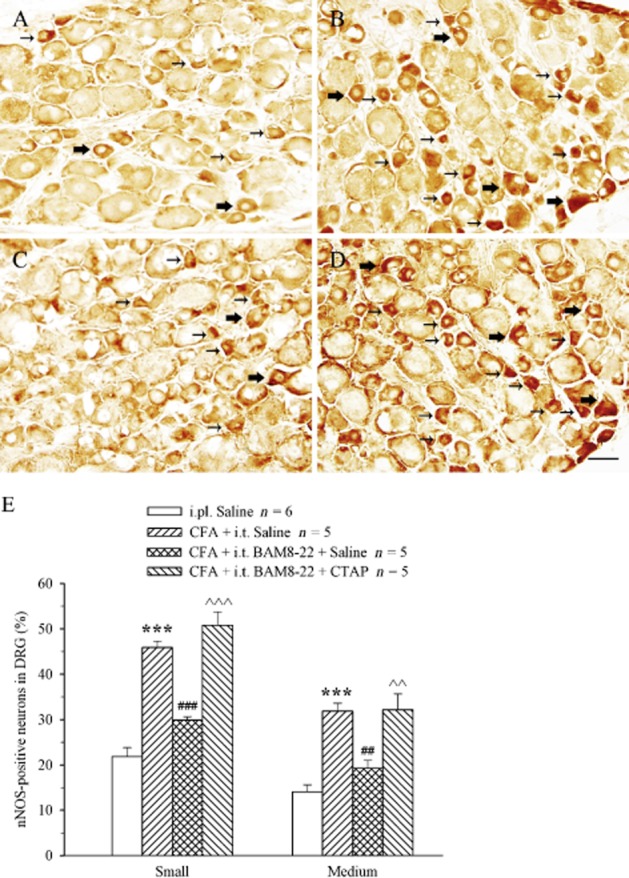
Figure 8.

Effect of i.t. administration of BAM8-22 on CFA-evoked expression of nNOS in DRG in the presence or absence of CTAP. Saline (A) or CFA (B, C and D) was i.pl. at 0 h. BAM8-22 (30 nmol; B, C and D) and saline (C) or CTAP (10 nmol; D) were administered i.t. at 0/24 and 24/48 h respectively. The L4-6 DRG were collected at 48.5 h. Photomicrographs of transverse sections of DRG show nNOS-IR expressions in small (small arrows) and medium (large arrows) neurons. Histograms show means ± SEM of nNOS-IR-positive neurons (E). ***P < 0.001 compared with saline group. ###P < 0.001 compared with CFA + i.t. saline group. ∧∧∧P < 0.001 compared with CFA + i.t. BAM8-22 group. Scale bar = 50 μm.
