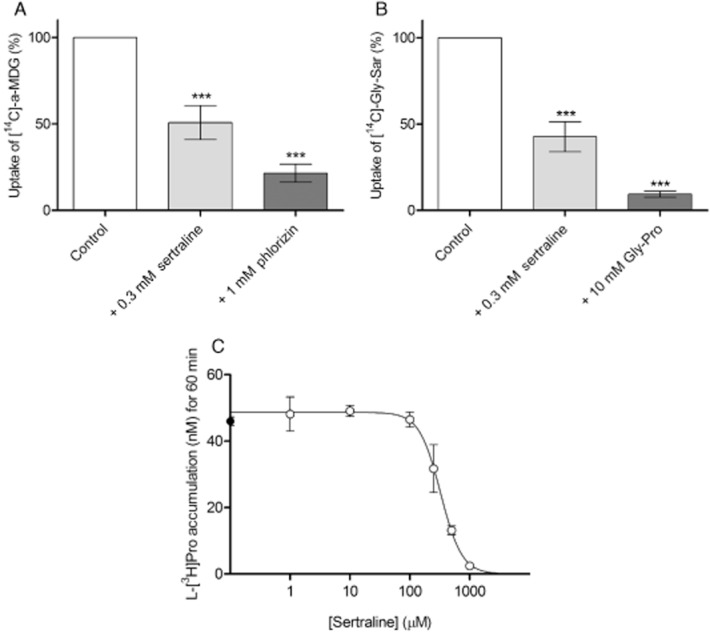
Figure 3.

(A) Uptake of 3.2 μM (1 μCi·mL−1) [14C]-α-MDG in Caco-2 cells in the absence (control) or presence of 0.3 mM sertraline or 1.0 mM phlorizin. The uptake was measured for 5 min in HBSS supplemented with 0.05% BSA and 10 mM MES; pH adjusted to 6.0, in three individual cell monolayers. The data represent mean ± SEM (n = 3). The data were analysed by a one-sample t-test; ** and **** denote P < 0.01 and P < 0.0001 significantly different from 100% respectively. (B) Uptake of 18 μM (1 μCi·mL−1) [14C]-Gly-Sar in Caco-2 cells in the absence (control) or presence of 0.3 mM sertraline or 10 mM Gly-Pro. The uptake was measured for 5 min in HBSS supplemented with 0.05% BSA and 10 mM MES; pH adjusted to 6.0 in three individual cell monolayers. The data represent mean ± SEM (n = 3). The data were analysed by a one-sample t-test; ** and **** denote P < 0.01 and P < 0.0001 significantly different from 100% respectively. (C) L-[3H]-Pro (13 nM, 1 μCi·mL−1) accumulation (nM; assuming an intercellular volume of 1 μL) in naked X. laevis oocytes. Uptake was measured for 60 min, and shown as a function of the sertraline concentration. Each data point represents the mean ± SEM of five to six oocytes. Sertraline concentration-dependently decreased L-[3H]-Pro uptake in oocytes with an IC50 value of 327 μM (LogIC50 of 2.5 ± 0.1) and a Hill slope of −2.5 ± 0.9.
