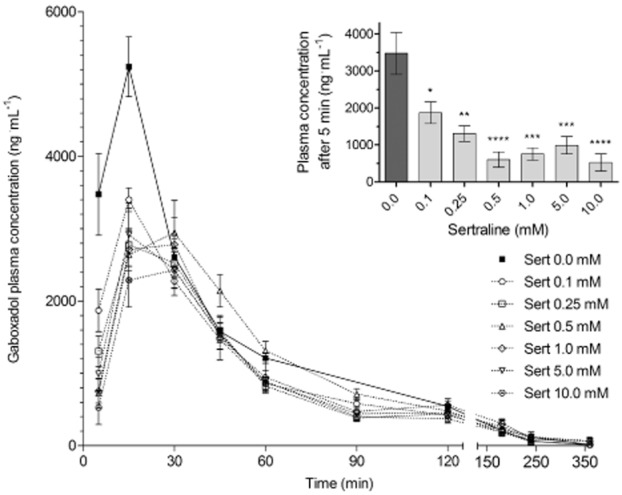
Figure 4.

Gaboxadol plasma concentration versus time profile following its administration p.o. Sprague–Dawley rats were pretreated with 0–10 mM (0–30.6 mg·kg−1) sertraline (Sert) p.o. 30 min before gaboxadol administration p.o. The gaboxadol dose was 10 mg·kg−1. Data are presented as mean ± SEM of measurements obtained from 6 to 12 rats per dosing group. Inset: Gaboxadol plasma concentrations measured in the first sampling time at 5 min as a function of sertraline concentration (pre-treatment). The one-way anova showed significant difference between the means at a level of P < 0.0001; *P < 0.05, **P < 0.01, ***P < 0.001, and ****P < 0.0001 significantly different from 0.0 mM sertraline, analysed by Dunnett's multiple comparison test.
