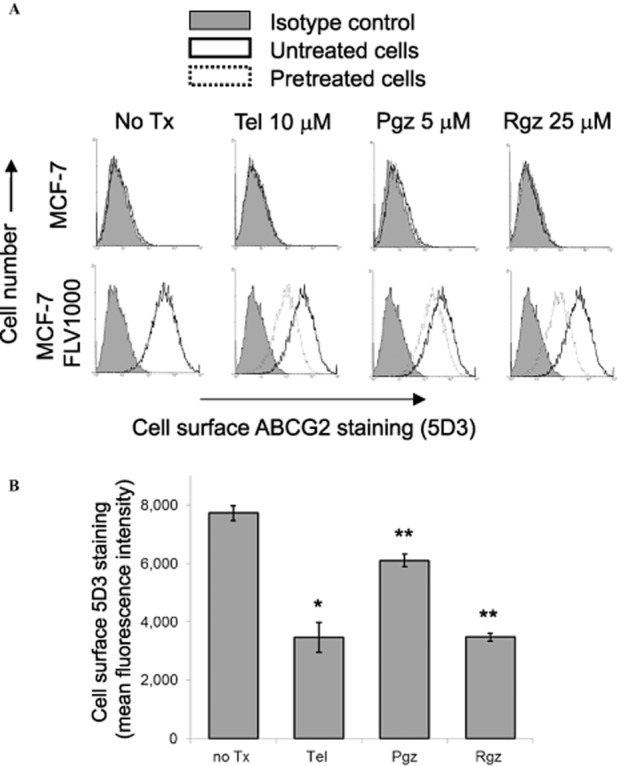
Figure 4.

ABCG2 surface expression of PPARγ agonists-treated MCF-7 and its ABCG2-overexpressing MCF-7 FLV1000 cells (24-h treatment). (A) Representative histograms showing the cell surface staining of ABCG2 by the 5D3 monoclonal antibody, which recognizes an extracellular epitope of ABCG2, of the untreated and PPARγ agonists-treated cells. Cells were trypsinized and incubated for 30 min in phycoerythrin (PE)-labelled negative control antibody (shaded histogram) or 5D3 antibody (solid line: untreated cells; dashed line: PPARγ agonists-treated cells) and analysed in a FACSsort flow cytometry. The distance between the 5D3 histogram (solid or dashed lines representing untreated and pretreated cells, respectively) and the shaded negative control antibody histogram provide an indication of the amount of ABCG2 protein expressed on the cell surface. The assays were repeated in three independent experiments. (B) Cell surface 5D3 staining of the resistant MCF-7 FLV1000 cells before and after a 24-h treatment with the indicated PPARγ agonists (telmisartan 10 μM, pioglitazone 5 μM, or rosiglitazone 25 μM) was quantified by subtracting the fluorescence signal from 5D3 labelling by that from the control IgG isotype labelling. Mean ± SD from three independent experiments is shown. *, P < 0.05; **, P < 0.01; compared with the untreated MCF-7 FLV1000 cells.
