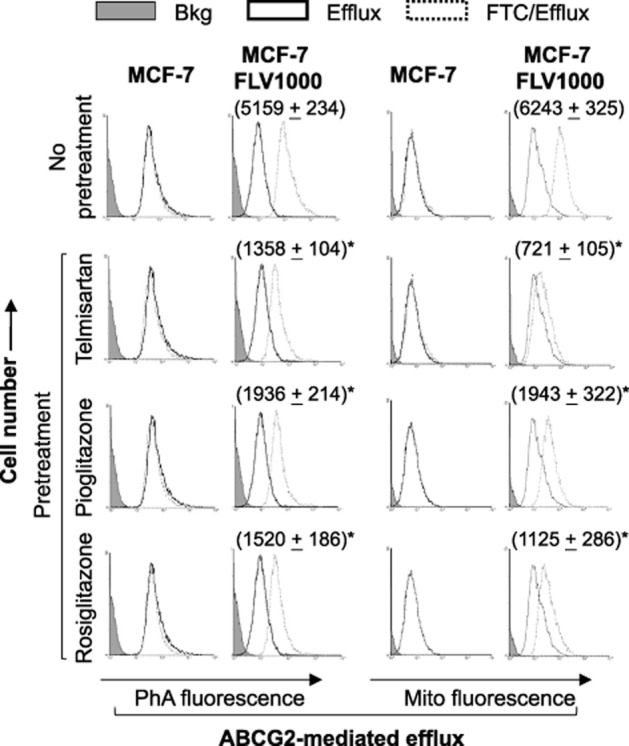
Figure 5.

Flow cytometric analysis of ABCG2 transport activity in cells pretreated with PPARγ agonists (telmisartan 10 μM; pioglitazone 5 μM; rosiglitazone 25 μM; 24-h treatment). Left panel: Cells were incubated for 30 min in complete media containing 1 μM pheophorbide A (PhA) with or without the ABCG2-specific inhibitor FTC (solid line – efflux/without FTC; dashed line – efflux/with FTC). The fluorescence signal between the efflux/with and efflux/without FTC histograms (i.e. ΔMFI) represents the ABCG2-mediated transport activity in the cells. Right panel: The same analysis as the left panel but PhA was replaced with a fluorescent anticancer drug mitoxantrone 10 μM (mito). Negligible ΔMFI was obtained for the parental MCF-7 cells. ΔMFI values for the resistant MCF-7 FLV1000 under the different PPARγ agonist treatments are reported in parenthesis (* P < 0.05, compared with untreated MCF-7 FLV1000 cells).
