
Figure 8.
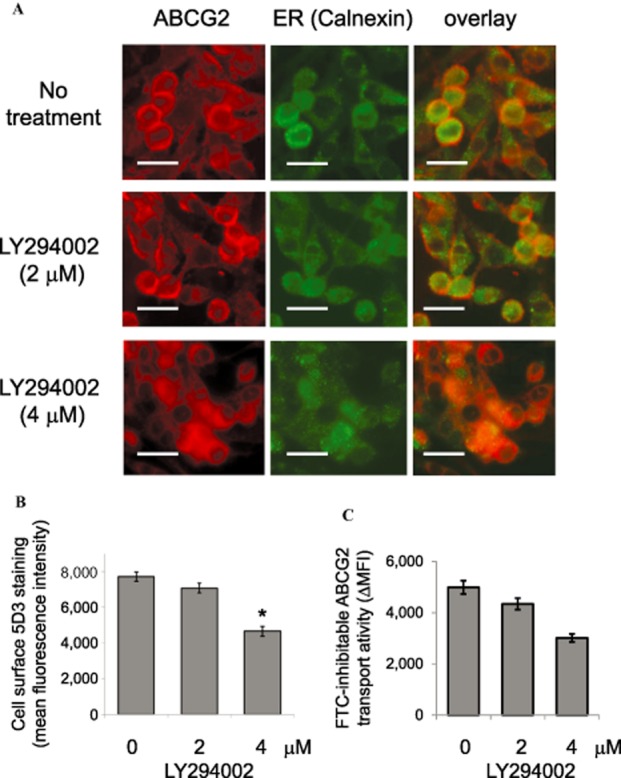
Immunofluorescence and flow cytometric analyses of the translocation of ABCG2 in MCF-7 FLV1000 cells before and after treatment with the PI3K inhibitor LY294002. (A) Confocal microscopy of MCF-7 FLV1000 cells after a 16-h treatment with 2 μM or 4 μM of LY294002 was performed as described in Figure 6. Representative images taken from three independent experiments are shown. Scale bar, 50 μm. (B) Cell surface 5D3 staining of MCF-7 FLV1000 cells after treatment with LY294002 was performed as described in Figure 4. (C) ABCG2 transport activity (FTC-inhibitable PhA efflux) in MCF-7 FLV1000 cells treated with LY294002 (16 h; 2 or 4 μM) was examined as in Figure 5. * P < 0.05, compared with untreated MCF-7 FLV1000 cells.