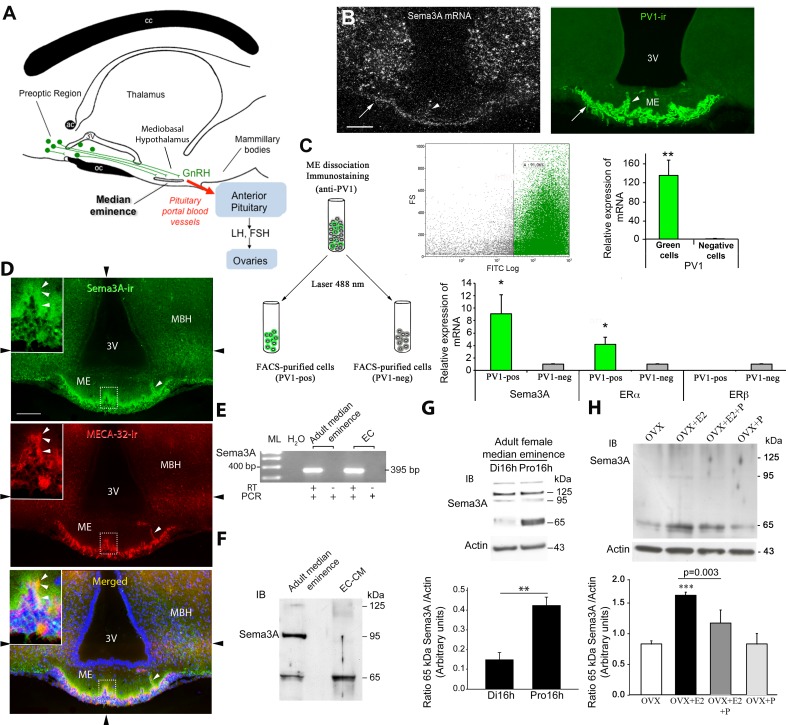
Figure 1. Sema3A expression in ME vascular endothelial cells during the ovarian cycle.
(A) Schematic diagram illustrating the anatomy of the hypothalamic-pituitary-gonadal axis in a sagittal view. In rodents, GnRH cell bodies (green circles) are diffusely distributed in the preoptic region and send neuroendocrine axons (green fibers) towards the ME of the hypothalamus, where they release the neurohormone into pituitary portal blood vessels (red arrow) for delivery to the anterior pituitary. At the adenohypophysis, GnRH elicits the secretion of the gonadotropins luteinizing hormone (LH) and follicle-stimulating hormone (FSH), which stimulate gametogenesis and gonadal-steroid secretion and thus support reproductive function. cc, corpus calosum; ac, anterior comissure; oc, optic chiasma; 3V, third ventricle. (B) Representative dark-field photomicrographs of a coronal section of an adult female rat ME, showing Sema3A mRNA localized using a radioactive probe (bright dots indicating silver grains, top panel). Note the presence of Sema3A mRNA in the capillary zone of the ME (white arrow) and in intrainfundibular capillary loops (arrowhead) containing PV1-immunoreactive fenestrated endothelial cells (right panel, green immunofluorescence), and its relative paucity in the parenchyma. Sema3A mRNA expression is also seen in various nuclei of the mediobasal hypothalamus (MBH) that lie adjacent to the ME but do not contain PV1-immunoreactive blood vessels. V3, third ventricle. Scale bar, 100 µm. (C) PV1-positive cell (PV1-pos) isolation by FACS (schematic diagram and dot plot, top) and real-time PCR analysis of PV1, Sema3A, estrogen receptor alpha (ERα), and ERβ transcripts. (D) Representative immunofluorescence images showing the localization of Sema3A immunoreactivity (green) in coronal sections of the ME of adult female mice. Fenestrated vascular endothelial cells are labeled by the monoclonal antibody MECA32, which binds to mouse PV1 (red). Note that Sema3A immunoreactivity is localized in portal blood capillaries of the external zone of the ME (inset) as well as some intrainfundibular capillary loops present in the nervous parenchyma (arrowhead); Sema3A immunolabelling is of very high intensity at the level of the capillary zone, but is also seen in the adjacent nervous parenchyma, progressively vanishing at deeper levels of the tissue. Nuclei are counterstained in blue using Hoechst. (Insets) High-magnification images of the areas indicated by dashed lines. Black arrowheads at the periphery of the pictures indicate the planes of the individual images that make up the photomontage; each panel is composed of an assembly of four images captured sequentially for each fluorophore using the MosaiX module of the AxioVision 4.6 system (Zeiss, Germany) and a Zeiss 20× objective (N.A. 0.8). Scale bar, 100 µm (30 µm in inset). (E) Detection by RT-PCR of Sema3A mRNA in total RNA extracts from ME explants microdissected from adult female rats and immunopurified ME endothelial cells (ECs). ML, 100 bp molecular ladder; H2O, PCR negative control without cDNA; +/−, Sema3A amplicon (395 bp) with (+) or without (−) RT. (F) Western blot analysis of Sema3A protein levels in the adult ME and 48 h ME EC-conditioned medium (EC-CM). Each lane was loaded with 35 µg of protein. While all Sema3A isoforms (65, 95, and 125 kDa) are detected in protein extracts from the adult female ME, only the 65 kDa Sema3A isoform is present in the EC-CM. (G) Western blot (top) and quantitative analysis (bottom, relative to actin) of Sema3A protein levels showing a difference in 65 kDa Sema3A expression between the afternoon of diestrus (Di16h) and proestrus (Pro16h), whereas the protein levels of 125 and 95 kDa Sema3A remain unchanged. Band intensity was quantified using Scion software. ** t(8) = 4.709, p = 0.0015 (n = 5 independent experiments). (H) Western blot analysis for Sema3A (top; upper image) and actin (top; lower image) in the ME of control ovariectomized (OVX) female rats and those treated with 17β-estradiol 3-benzoate (E2), progesterone (P), or E2+P (n = 5 independent experiments per treatment). E2 induces a significant increase in 65 kDa Sema3A expression in the ME of OVX rats when compared with the other treatment groups (one-way ANOVA, F(8,11) = 27.779, p<0.001; Tukey's test, ***p<0.001), whereas progesterone inhibits this increase (Tukey's test, p = 0.003). Bar graph, mean ratio (±SEM) of Sema3A expression to that of actin (p<0.05, one-way ANOVA). Data are represented as means ± SEM.

