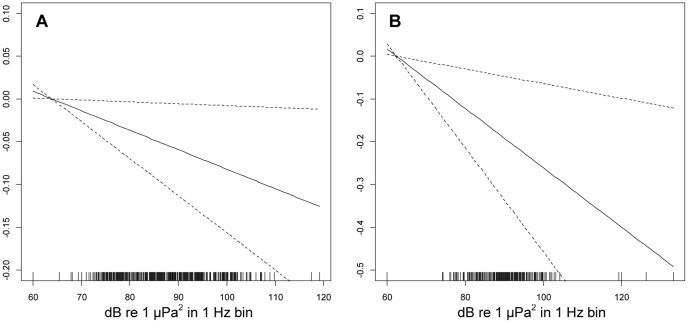
Figure 4. Impact of seismic survey pulse RL on humpback whale singing activity for the full dataset.
Generalized Additive Mixed Models of the number of humpback whale singers with smooth terms for the dependence on Survey Day, Hour, Moon Phase and Peak Power fitted for each of the MARUs; plots show the estimated conditional dependence of humpback whale singer numbers on Peak Power for (A) MARU 1 and (B) MARU 2. The x-axis in each plot shows Peak Power, describing received level of seismic survey pulse (in dB re: 1 µPa2 in a 1 Hz frequency bin) with a rug plot (short vertical bars) indicating the Peak Power values of observations. The y-axis, with scale selected optimally for each plot, shows the contribution of the smooth of Peak Power to the fitted values of singer number. Estimates (solid lines) are shown with 95% confidence bands (dashed lines), indicating a significant downward trend in singer number with increasing pulse RL.

