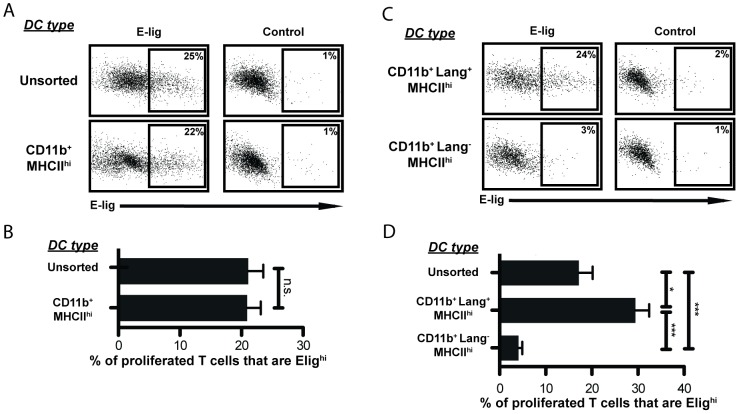
Figure 4. CD11b+Langerin+MHCIIhi DCs induce E-lig.
A: Representative example of E-lig expression on CD8 T cells after co-culture with unsorted DCs or sorted CD11b+ MHCIIhi DCs. Control was stained in the presence of EDTA (which disrupts Ca++-dependent E-selectin binding) to determine non-specific binding of the E-selectin-Ig chimera. Flow cytometry plots are gated on CFSE-low CD8+ T cells. Vertical axis: side scatter. Plots representative of 3 different experiments of 5–8 wells each (depending on DC yield). 3433 cells shown per panel. B: E-lig expression depicted as the percentage of proliferated T cells expressing high levels of E-lig. E-lighi expression was observed only on proliferated T cells, so undivided T cells are not included in the calculation. Data from co-cultures with unsorted DCs or sorted CD11b+ MHCIIhi DCs are compared within a given experiment. sdLN from 10 immunized mice were pooled before DC sorting. N = 3 experiments. One-tailed Mann-Whitney p values shown. n.s. = not significant. C: Representative example of E-lig expression on CD8 T cells after co-culture with CD11b+ Lang+ or CD11b+ Lang- MHCIIhi DCs. Control stained as in A. Flow cytometry plots are gated on CFSE-low CD8+ T cells. Vertical axis: side scatter. Plots are representative of samples from 4 different experiments of 3–8 wells each (depending on DC yield). 1623 cells shown per panel. D: E-lig expression depicted as the percentage of proliferated OT-I T cells that are E-lighi as in B, Data from co-cultures with unsorted DCs and sorted Lang+ or Lang- CD11b+ MHCIIhi DCs compared within a given experiment. sdLN from 10 immunized mice were pooled before DC sorting. N = 4 experiments. One-tailed Mann-Whitney p values shown. *p<.01; ***p<.0001.

