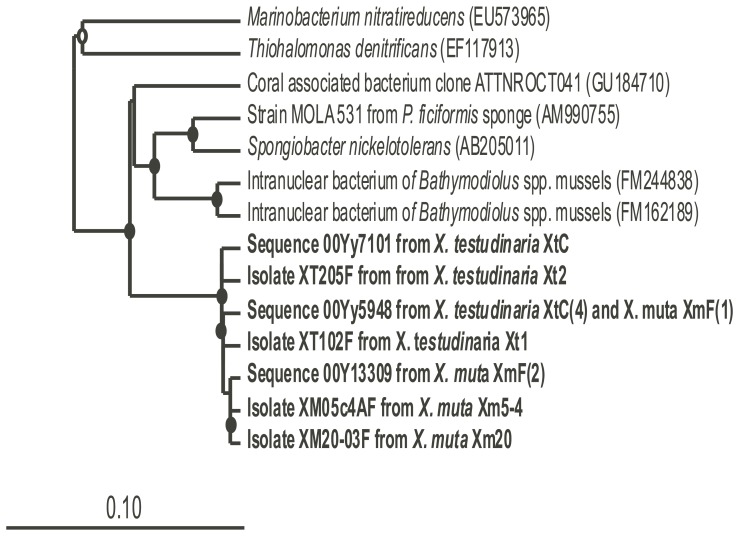
Figure 4. Phylogenetic tree of shared OTUs in the culture-based and culture-independent analysis of Xestospongia spp.
Sequences from this study are bolded and their closest relatives are included. Bootstrap values (neighboring-joining method, 100 replicates) are indicated by closed circles (values >90%) and open circles (values >75%). The scale bar represents 10% sequence divergence.

