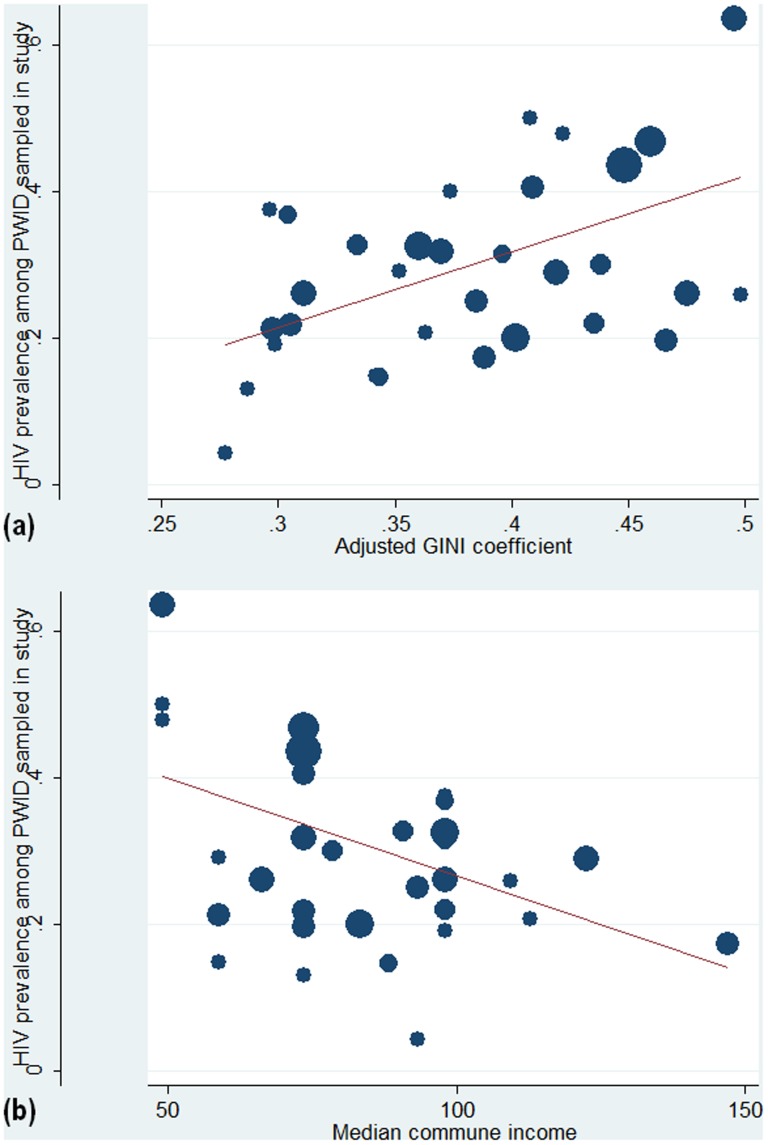
Figure 1. Ecological scatterplots show the relationship between HIV prevalence in our study sample of PWID, and the distribution or level of income for the 32 communes in Thai Nguyen, Vietnam.
A, Crude GINI coefficient is shown along the X-axis. B, GINI coefficients adjusted with a first-order correction factor to account for variable and small sample sizes shown along the X-axis. C, median commune income is shown along the X-axis. Size of the circle represents weighting according to the total number of PWID enrolled from the commune.

