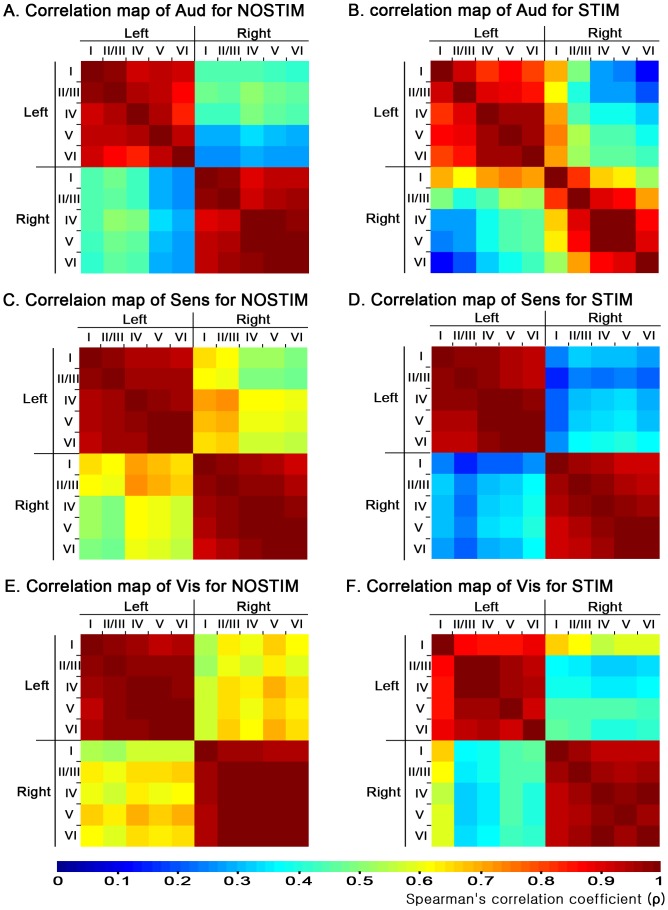
Figure 2. Spearman's rank correlation maps between the mean SIRs of each layer in cortices.
(A) Correlation map of Aud for NOSTIM (B) Correlation map of Aud for STIM (C) Correlation map of Sens for NOSTIM (D) Correlation map of Sens for STIM (E) Correlation map of Vis for NOSTIM (F) Correlation map of Vis for STIM. The correlation coefficient, ρ, is indicated with color maps ranging from blue to red; blue and red indicates the weakest and strongest correlation, respectively. A strong correlation between two layers indicates that the manganese accumulations in the two are likely to be linearly proportional to each other.

