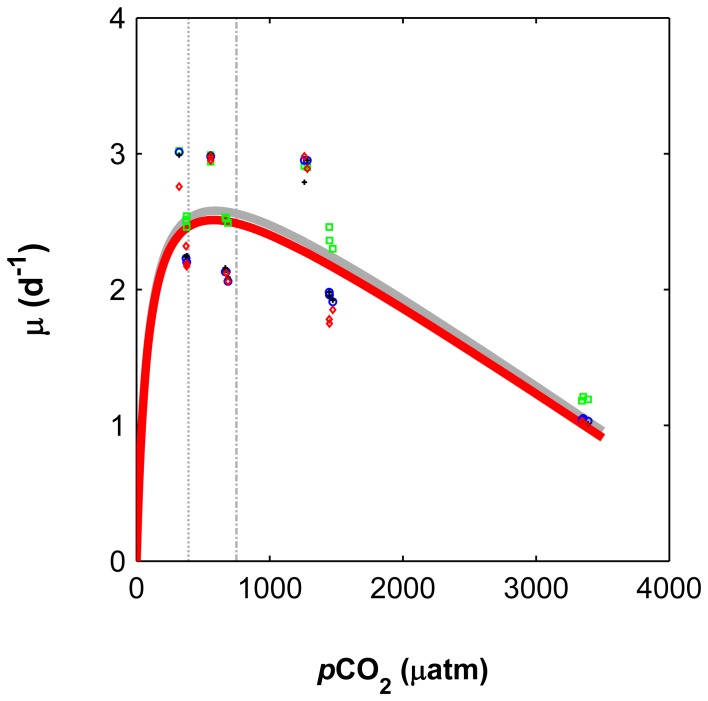
Figure 3. Cell division rates based on cell counts and POP/C/N in relation to CO2 levels (from ∼600 to 3400 µatm, p<0.01).
The solid line depicts a tendency line obtained by fitting the Asterionellopsis glacialis cell based data (red line) and a combination of cell, POP, POC and PON data (grey line) to an equation following a modified Michaelis-Menten curve. Markers correspond to cell division rates based on POP (green), POC (black), PON (blue) and cell numbers (red). Dashed vertical lines correspond to 390 and 750 µatm.

